. 2012 Aug 28;7(1):21.
doi: 10.1186/1750-9378-7-21.

Epstein-barr virus infected gastric adenocarcinoma expresses latent and lytic viral transcripts and has a distinct human gene expression profile

Affiliations

Epstein-barr virus infected gastric adenocarcinoma expresses latent and lytic viral transcripts and has a distinct human gene expression profile

Weihua Tang et al. Infect Agent Cancer. .

Abstract

Background: EBV DNA is found within the malignant cells of 10% of gastric cancers. Modern molecular technology facilitates identification of virus-related biochemical effects that could assist in early diagnosis and disease management.

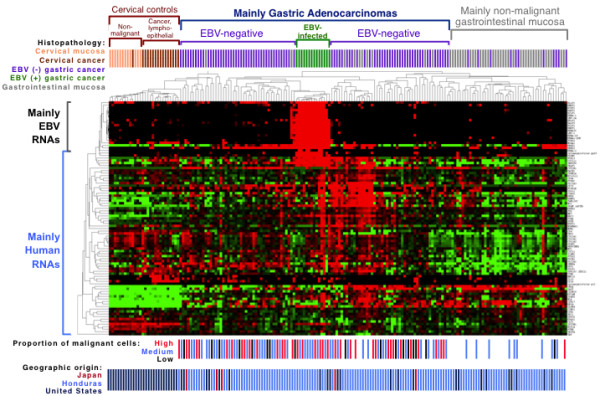
Methods: In this study, RNA expression profiling was performed on 326 macrodissected paraffin-embedded tissues including 204 cancers and, when available, adjacent non-malignant mucosa. Nanostring nCounter probes targeted 96 RNAs (20 viral, 73 human, and 3 spiked RNAs).

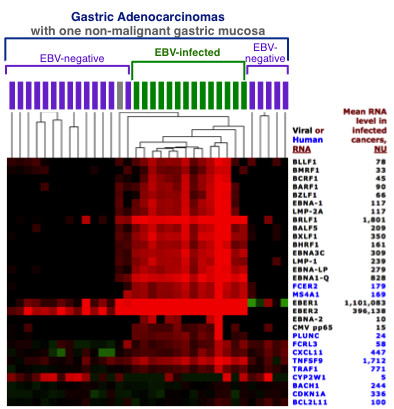
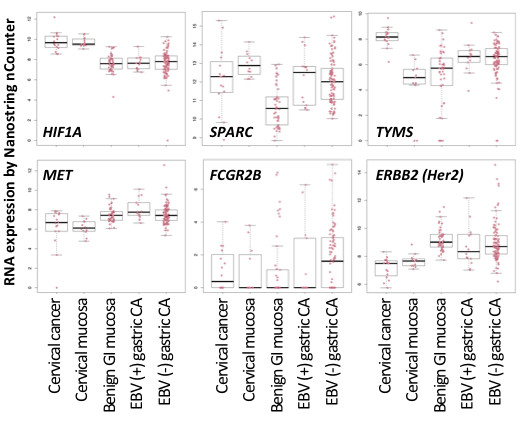
Results: In 182 tissues with adequate housekeeper RNAs, distinct profiles were found in infected versus uninfected cancers, and in malignant versus adjacent benign mucosa. EBV-infected gastric cancers expressed nearly all of the 18 latent and lytic EBV RNAs in the test panel. Levels of EBER1 and EBER2 RNA were highest and were proportional to the quantity of EBV genomes as measured by Q-PCR. Among protein coding EBV RNAs, EBNA1 from the Q promoter and BRLF1 were highly expressed while EBNA2 levels were low positive in only 6/14 infected cancers. Concomitant upregulation of cellular factors implies that virus is not an innocent bystander but rather is linked to NFKB signaling (FCER2, TRAF1) and immune response (TNFSF9, CXCL11, IFITM1, FCRL3, MS4A1 and PLUNC), with PPARG expression implicating altered cellular metabolism. Compared to adjacent non-malignant mucosa, gastric cancers consistently expressed INHBA, SPP1, THY1, SERPINH1, CXCL1, FSCN1, PTGS2 (COX2), BBC3, ICAM1, TNFSF9, SULF1, SLC2A1, TYMS, three collagens, the cell proliferation markers MYC and PCNA, and EBV BLLF1 while they lacked CDH1 (E-cadherin), CLDN18, PTEN, SDC1 (CD138), GAST (gastrin) and its downstream effector CHGA (chromogranin). Compared to lymphoepithelioma-like carcinoma of the uterine cervix, gastric cancers expressed CLDN18, EPCAM, REG4, BBC3, OLFM4, PPARG, and CDH17 while they had diminished levels of IFITM1 and HIF1A. The druggable targets ERBB2 (Her2), MET, and the HIF pathway, as well as several other potential pharmacogenetic indicators (including EBV infection itself, as well as SPARC, TYMS, FCGR2B and REG4) were identified in some tumor specimens.

Conclusion: This study shows how modern molecular technology applied to archival fixed tissues yields novel insights into viral oncogenesis that could be useful in managing affected patients.


Figures

Figure 1
Figure 1
Expression profiles of 182 tissues for 20 viral genes and 73 human genes. A heat map displays unsupervised hierarchical clustering of each tissue in a separate column, and each RNA in a separate row. The data is median-centered with red indicating relative overexpression and green indicating relative under-expression for each gene. Correlative data above the map indicates histopathologic classification with further subclassification of the gastric cancer cohort into 14 EBV infected and 104 EBV negative cancers based on EBV DNA levels. Below the map, each gastric cancer is categorized by the proportion of malignant cells, and geographic origin of each tissue is shown.
Figure 2
Figure 2
EBV-encoded RNA levels are high in infected gastric cancer and are proportion to EBV genome level. A. Box plots of EBER1 and EBER2 in benign and malignant tissues reveal that EBV-infected gastric cancer has substantially higher levels of EBER1 and EBER2 non-coding RNAs than do uninfected cancers and control tissues. Proposed thresholds for EBER1 or EBER2 are shown beyond which a gastric cancer could reliably be designated as EBV-infected. Each dot represents an individual analytic result on a log2 normalized unit (NU) scale. B. Pairwise comparison of EBER1 and EBER2 RNA levels by Nanostring nCounter array and EBV DNA viral load by Q-PCR reveals a linear association between levels of each of these analytes. Pearson correlation coefficients (P >0.86) are shown. The previously validated level of EBV DNA viral load is shown beyond which EBER was always localized to malignant cells by EBER in situ hybridization (threshold of 10,558 EBV genomes per 100,000 cells, which is equivalent to 13.37 on this log2 scale) [46]. Proposed cutoffs for RNA levels are indicated for both EBER1 (200,000 NU, or 17.61 on this log 2 scale) and EBER2 (100,000 NU, or 16.61 on this log2 scale). The one outlier is a non-malignant gastric mucosa that was located adjacent to an EBV-infected gastric cancer, and this mucosa had an EBV DNA load equivalent to that of infected cancers, but it would have been correctly excluded from the EBV-infected cancer group if either EBER1 or EBER2 RNA levels were used, or if histology were used, to screen for EBV-related malignancy.
Figure 3
Figure 3
Multiple human RNAs are over-expressed in EBV-infected gastric cancer compared to EBV-negative cancer. Box plots demonstrate the human RNAs levels in infected compared to uninfected gastric cancers and controls that include lymphoepithelioma-like cervical cancer, cervical mucosa, and benign gastrointestinal mucosa. Each dot represents an individual analytic result on a log2 normalized unit scale.
Figure 4
Figure 4
Latent and lytic EBV genes are co-expressed in gastric cancer. A portion of the heat map from Figure 1 is displayed in high contrast to decipher relative expression levels of EBV genes in the 14 EBV-infected gastric cancers and surrounding specimens. All tissues are gastric cancers except a single non-malignant gastric mucosa, shown in grey, dissected from the same paraffin block as an EBV-infected gastric cancer. Mean expression level of each RNA in the EBV-infected gastric cancer cohort is shown to the right of each gene symbol.
Figure 5
Figure 5
Some gastric cancers have significant dysregulation of factors that show promise as pharmacogenetic predictors. Box plots demonstrate expression of selected pharmacogenetic targets in infected versus non-infected gastric cancers as well as non-malignant gastric mucosa and cervical histopathologies. Each dot represents an individual analytic result on a log2 normalized unit scale.

References

    1. Jemal A, Bray F, Center MM, Ferlay J, Ward E, Forman D. Global cancer statistics. CA Cancer J Clin. 2011;61:69–90. doi: 10.3322/caac.20107. - DOI - PubMed
    1. Ferlay J, Shin HR, Bray F, Forman D, Mathers C, Parkin DM. Estimates of worldwide burden of cancer in 2008: GLOBOCAN 2008. Int J Cancer. 2010;127:2893–2917. doi: 10.1002/ijc.25516. - DOI - PubMed
    1. Cho HJ, Kim JY, Yoo J, Lee SS. Gastric carcinoma with lymphoid stroma: incidence of EBV and Helicobacter pylori infection. Appl Immunohistochem Mol Morphol. 2003;11:149–152. doi: 10.1097/00129039-200306000-00010. - DOI - PubMed
    1. Chan WY, Liu Y, Li CY, Ng EK, Chow JH, Li KK, Chung SC. Recurrent genomic aberrations in gastric carcinomas associated with Helicobacter pylori and Epstein-Barr virus. Diagn Mol Pathol. 2002;11:127–134. doi: 10.1097/00019606-200209000-00001. - DOI - PubMed
    1. Saxena A, Nath Prasad K, Chand Ghoshal U, Krishnani N, Roshan Bhagat M, Husain N. Association of Helicobacter pylori and Epstein-Barr virus with gastric cancer and peptic ulcer disease. Scand J Gastroenterol. 2008;43:669–674. doi: 10.1080/00365520801909660. - DOI - PubMed