. 2012 Nov;32(11):2076-83.
doi: 10.1038/jcbfm.2012.116. Epub 2012 Aug 29.

Energy demand of synaptic transmission at the hippocampal Schaffer-collateral synapse

Affiliations

Energy demand of synaptic transmission at the hippocampal Schaffer-collateral synapse

Agustin Liotta et al. J Cereb Blood Flow Metab. 2012 Nov.

Abstract

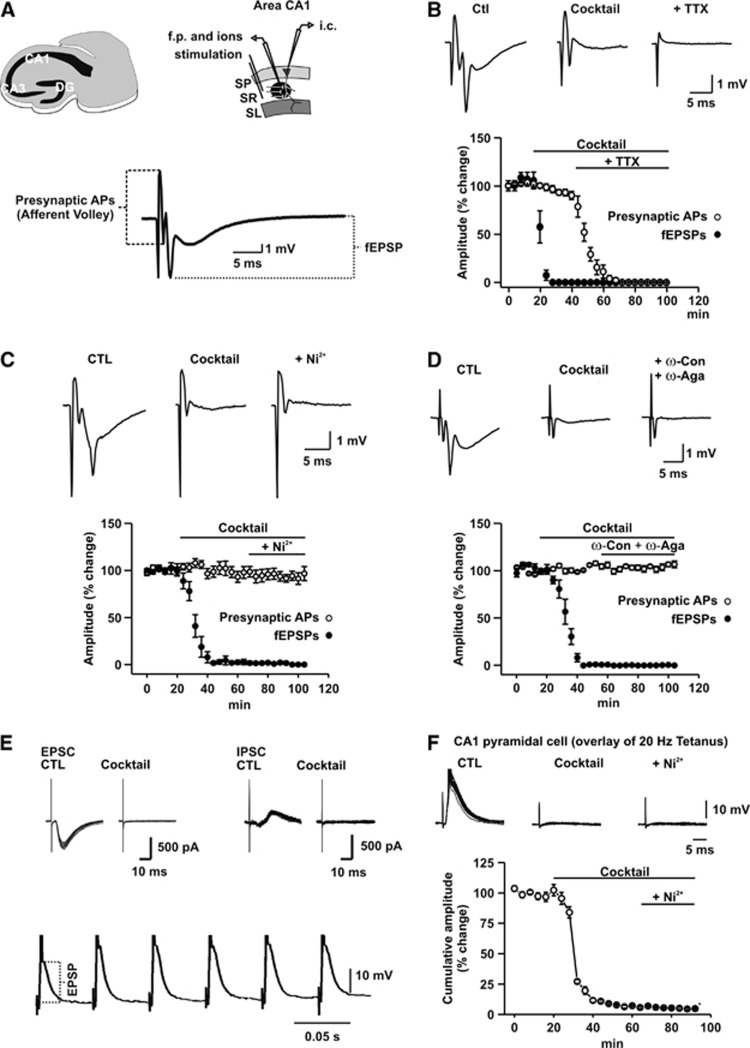
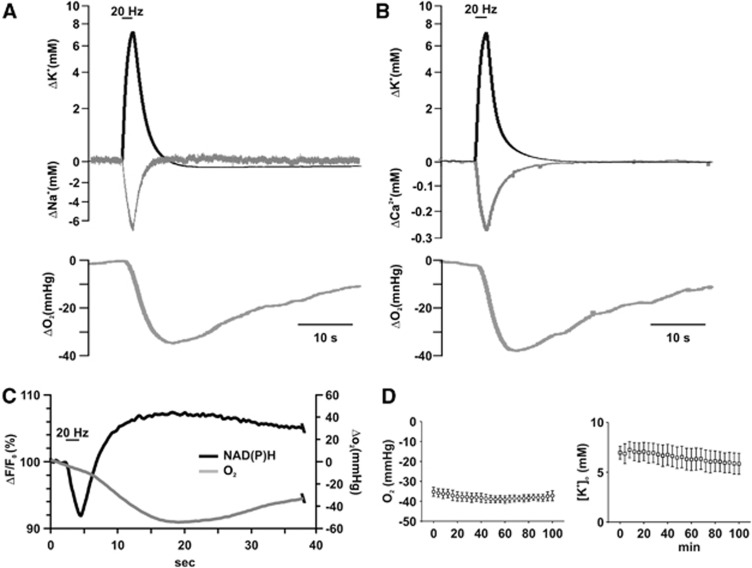
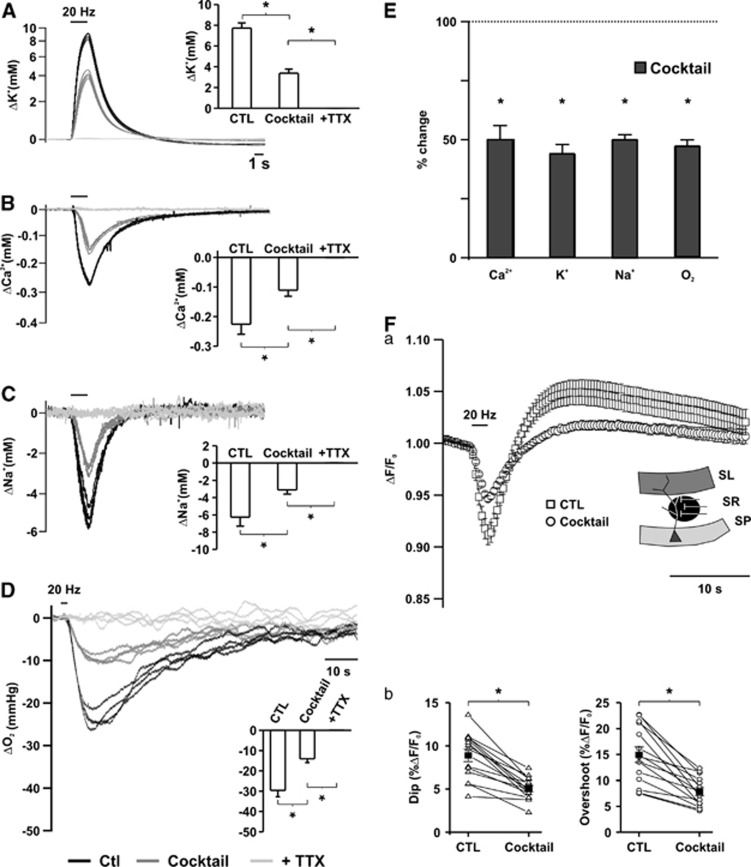
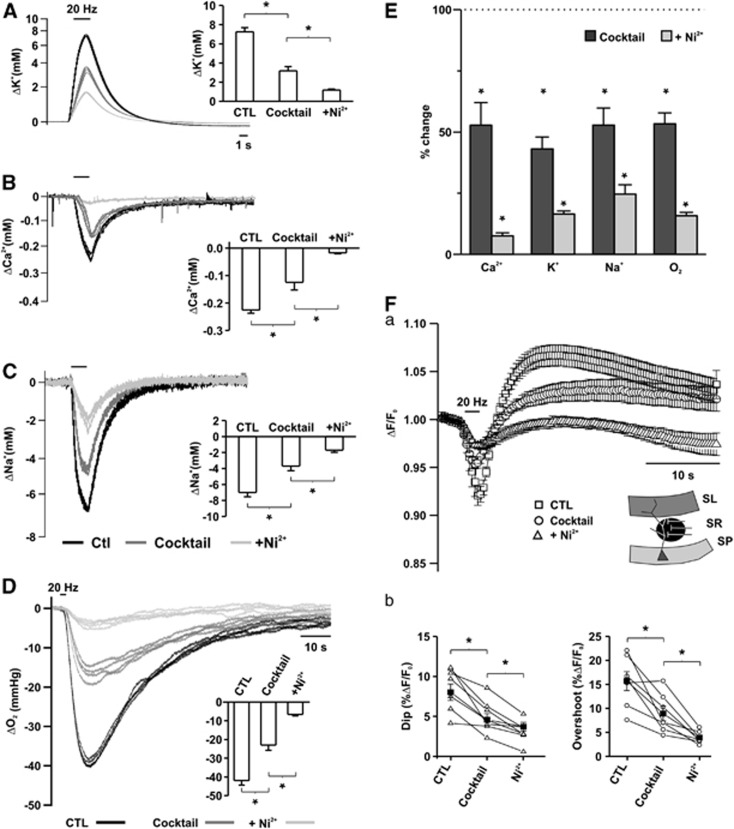
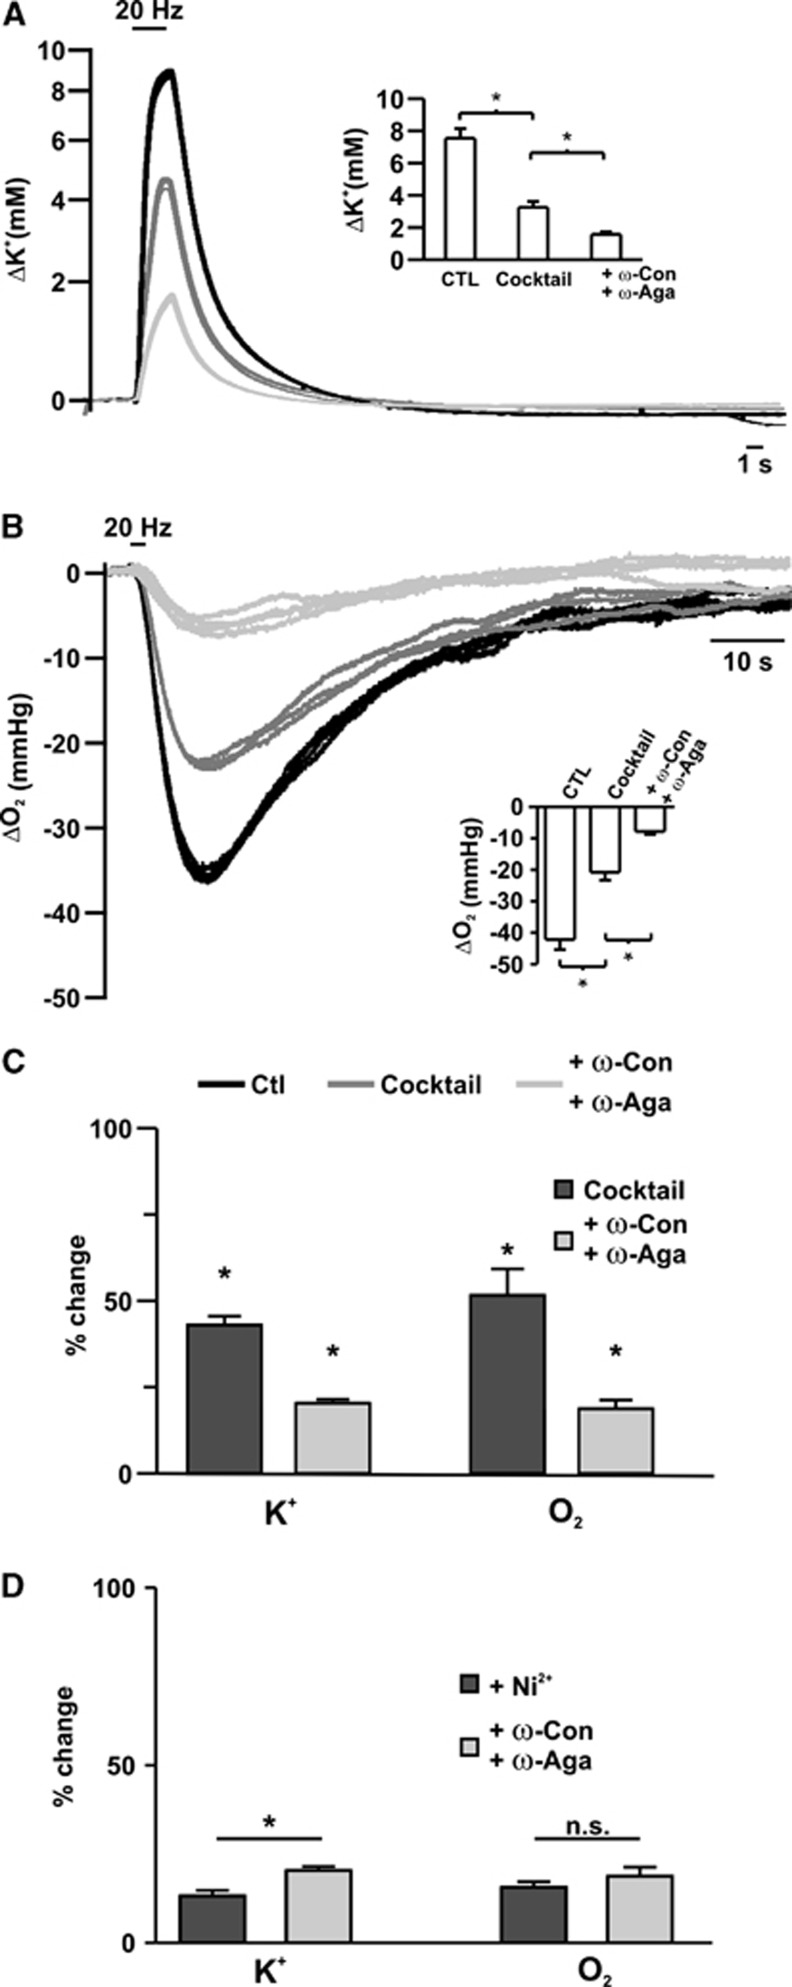
Neuroenergetic models of synaptic transmission predicted that energy demand is highest for action potentials (APs) and postsynaptic ion fluxes, whereas the presynaptic contribution is rather small. Here, we addressed the question of energy consumption at Schaffer-collateral synapses. We monitored stimulus-induced changes in extracellular potassium, sodium, and calcium concentration while recording partial oxygen pressure (pO(2)) and NAD(P)H fluorescence. Blockade of postsynaptic receptors reduced ion fluxes as well as pO(2) and NAD(P)H transients by ∼50%. Additional blockade of transmitter release further reduced Na(+), K(+), and pO(2) transients by ∼30% without altering presynaptic APs, indicating considerable contribution of Ca(2+)-removal, transmitter and vesicle turnover to energy consumption.


Figures

Figure 1
Figure 1
Changes in field potential (fp) responses and excitatory postsynaptic potential amplitude (EPSPs) during sequential blockade of postsynaptic receptors, voltage-gated Ca2+-channels, and action potentials (APs). (A) Schematic representation of the recording design and stimulus-induced fp responses in the str. radiatum (SR) of CA1 (SP, stratum pyramidale and SL: stratum lacunosum moleculare). Presynaptic APs were represented by the afferent volley, the shortest latency component of the fp response. Postsynaptic responses including postsynaptic population spike and field EPSPs (fEPSP) were quantified by measuring the amplitude of the subsequent negative deflection of the fp response. (B) Effect of sequential blockade of glutamate and GABAA receptors and APs on the different components of the fp response in percentage of the control (CTL). Note that the cocktail blocks fEPSP and postsynaptic APs completely within 20 minutes. Field potential is completely abolished in the presence of TTX, indicating that no direct activation of postsynaptic cells occurred. (C) Effect of sequential blockade of glutamate and GABAA receptors and presynaptic Ca2+-entry by Ni2+ on the different components of the fp response in percentage of the control. Note that presynaptic APs remain unchanged in the presence of Ni2+. (D) Effect of sequential blockade of glutamate and GABAA receptors and presynaptic Ca2+-entry by ω-Conotoxin MVIIC/ω-Agatoxin TK (ω-Con/ω-Aga) on the different components of the fp response in percentage of the control. Similarly to Ni2+ ω-Con/ω-Aga did not influence presynaptic APs as represented by the afferent volley. (E) Effect of glutamate and GABAA receptors on the EPSCs/IPSCs in CA1 pyramidal cell under submerged conditions. Overlay of EPSCs/IPSCs of a stimulus train aligned by the stimulation artifact (upper traces). Note the disappearance of synaptic components in the presence of the cocktail. First six pulses of stimulus train as recorded with a sharp electrode from a CA1 pyramidal cell under interface conditions (lower trace). Note a slight increase of the EPSP amplitude from the first to the second stimulus. (F) Overlay of EPSPs during sequential blockade of glutamate and GABAA receptors and presynaptic Ca2+-entry by Ni2+. EPSP was almost completely inhibited by the cocktail, whereas subsequent application of Ni2+ did not cause a further reduction of the EPSP amplitude.
Figure 2
Figure 2
Kinetics of stimulus-induced [K+]o, [Ca2+]o, [Na+]o, partial oxygen pressure (pO2), and NAD(P)H transients. (A) Simultaneously measured changes in [K+]o, [Na+]o, and pO2. The start of the decrease in pO2 is delayed as compared with the ion fluxes and the falling phase of the pO2 transient overlaps with the phase of recovery of ion transients. (B) Simultaneously measured changes in [K+]o, [Ca2+]o, and pO2. Although recovery of [Ca2+]o is slightly slower than that of [Na+]o, it still overlaps with the largest part of falling phase of pO2. (C) Simultaneous recording of pO2 and NAD(P)H fluorescence transients under submerged conditions. Decrease of the NAD(P)H fluorescence represents a shift to the oxidized, an increase in the fluorescence to the reduced form of NAD(P)H. pO2 as measured with the Clark-style oxygen electrode lags behind the changes in the fluorescence, suggesting that O2 diffusion in the tissue might alter the kinetics of pO2 transients. Note that NAD(P)H/NAD(P)+ ratio is increased during the whole period of enhanced O2 consumption. Stimulation lengths are indicated with the bars on the top of (AC). (D) Amplitude of stimulus-induced pO2 and [K+]o transients did not change significantly over 100 minutes of repeated stimulation, indicating that neither synaptic facilitation nor synaptic depression occur with 20 Hz stimulation protocol.
Figure 3
Figure 3
Ion fluxes, oxygen consumption, and redox changes as created by pre- and postsynaptic processes. Changes in [K+]o (A), [Ca2+]o (B), [Na+]o (C), and partial oxygen pressure (pO2) (D) transients during sequential blockade of glutamate and GABAA receptors and action potentials (APs). (E) Comparison of the changes in ion fluxes and oxygen consumption in percentage of control. Note that ∼50% of ion fluxes and pO2 changes were removed by inhibition of glutamate and GABAergic transmission. Asterisks mark statistical significance (repeated measures analysis of variance (ANOVA)). (Fa) Changes in biphasic NAD(P)H transients during blockade of glutamatergic and GABAergic transmission, the insert representing the area where the fluorescence was recorded. (Fb) Comparison of dip and overshoot components of NAD(P)H transients. Both components decreased equally in the presence of the cocktail.
Figure 4
Figure 4
Ion fluxes, oxygen consumption, and redox changes as created by presynaptic action potentials (APs) and transmitter release linked processes. Changes in [K+]o (A), [Ca2+]o (B), [Na+]o (C), and partial oxygen pressure (pO2) (D) transients during sequential blockade of glutamate and GABAA receptors and vesicle release by Ni2+. (E) Comparison of the changes in ion fluxes and oxygen consumption in percentage of control. Note that ∼50% of ion fluxes and pO2 changes were removed by inhibition of glutamate and GABAergic transmission and Ni2+ further decreased all ion and pO2 transients by ∼30%, in spite of the unaltered presynaptic APs. Asterisks mark statistical significance (repeated measures analysis of variance (ANOVA)). (Fa) Changes in biphasic NAD(P)H transients during blockade of glutamatergic and GABAergic transmission and vesicle release by Ni2+. (Fb) Comparison of dip and overshoot components of NAD(P)H transients. Both components were further decreased in the presence of Ni2+.
Figure 5
Figure 5
Changes in stimulus-induced [K+]o and partial oxygen pressure (pO2) transients during sequential blockade of synaptic transmission and presynaptic Ca2+-entry. Changes in [K+]o (A) and pO2 (B) transients during sequential blockade of glutamate and GABAA receptors and vesicle release by ω-Conotoxin MVIIC/ω-Agatoxin TK (ω-Con/ω-Aga). (C) Comparison of the changes in [K+]o fluxes and oxygen consumption in percentage of control. ω-Con/ω-Aga decreased [K+]o and pO2 transients by about an additional 30%. Asterisks mark statistical significance (repeated measures analysis of variance (ANOVA)). (D) Comparison of the effects of Ni2+ and ω-Con/ω-Aga on [K+]o and pO2 transients. Although Ni2+ had a significantly larger effect on the [K+]o transients, the reduction in pO2 transients was not different between Ni2+ and ω-Con/ω-Aga-treated groups (Student's t-test).

References

    1. Attwell D, Gibb A. Neuroenergetics and the kinetic design of excitatory synapses. Nat Rev Neurosci. 2005;6:841–849. - PubMed
    1. Attwell D, Laughlin SB. An energy budget for signaling in the grey matter of the brain. J Cereb Blood Flow Metab. 2001;21:1133–1145. - PubMed
    1. Alle H, Roth A, Geiger JR. Energy-efficient action potentials in hippocampal mossy fibers. Science. 2009;325:1405–1408. - PubMed
    1. Carter BC, Bean BP. Sodium entry during action potentials of mammalian neurons: incomplete inactivation and reduced metabolic efficiency in fast-spiking neurons. Neuron. 2009;64:898–909. - PMC - PubMed
    1. Schmidt-Hieber C, Bischofberger J. Fast sodium channel gating supports localized and efficient axonal action potential initiation. J Neurosci. 2010;30:10233–10242. - PMC - PubMed

Publication types

MeSH terms

LinkOut - more resources