. 2012 Oct;103(4):356-66.
doi: 10.1097/HP.0b013e3182666d6f.

Long-term hematopoietic stem cell damage in a murine model of the hematopoietic syndrome of the acute radiation syndrome

Affiliations

Long-term hematopoietic stem cell damage in a murine model of the hematopoietic syndrome of the acute radiation syndrome

Hui Lin Chua et al. Health Phys. 2012 Oct.

Abstract

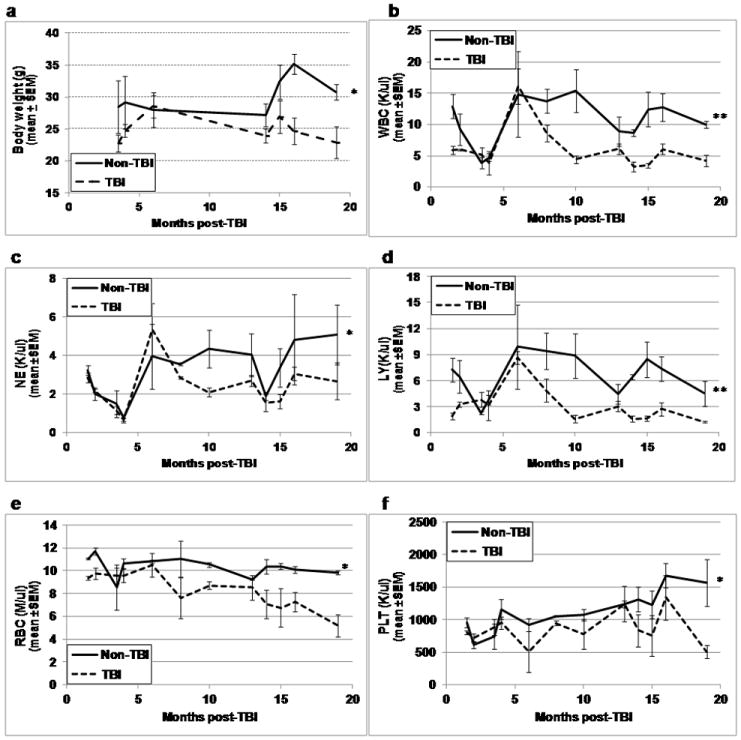
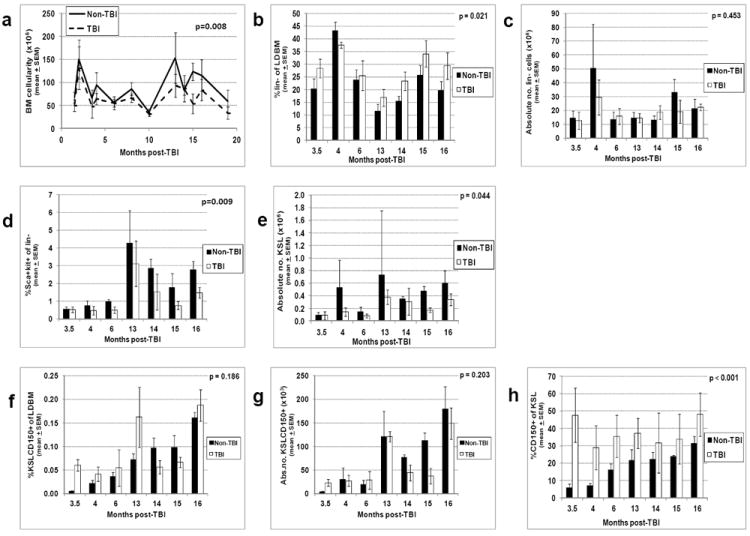
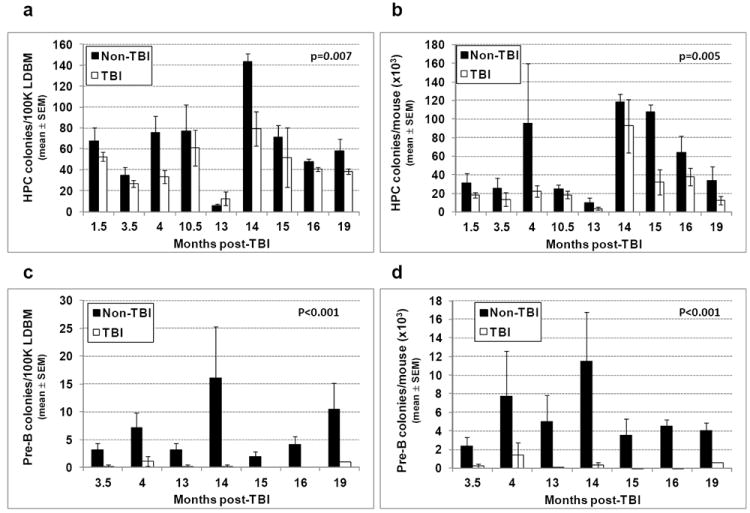
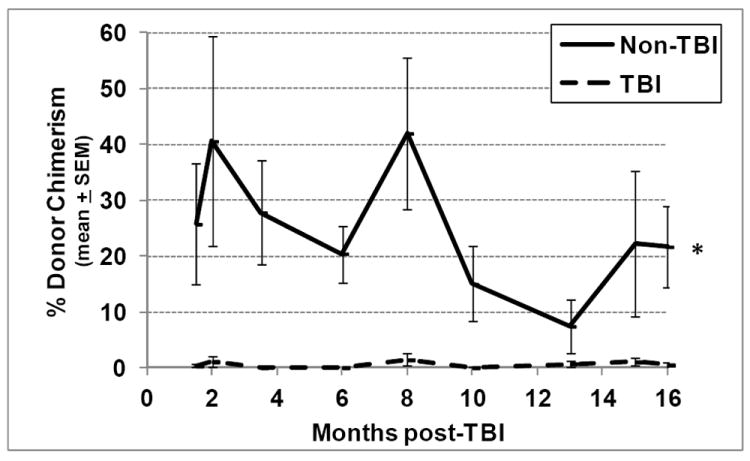
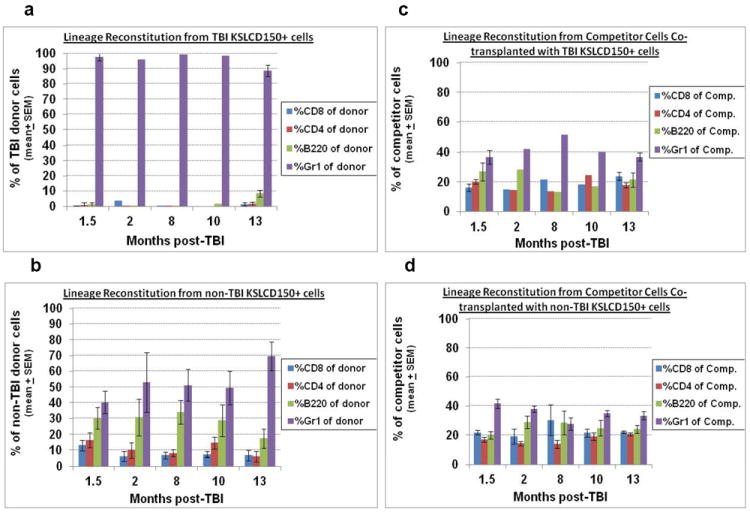
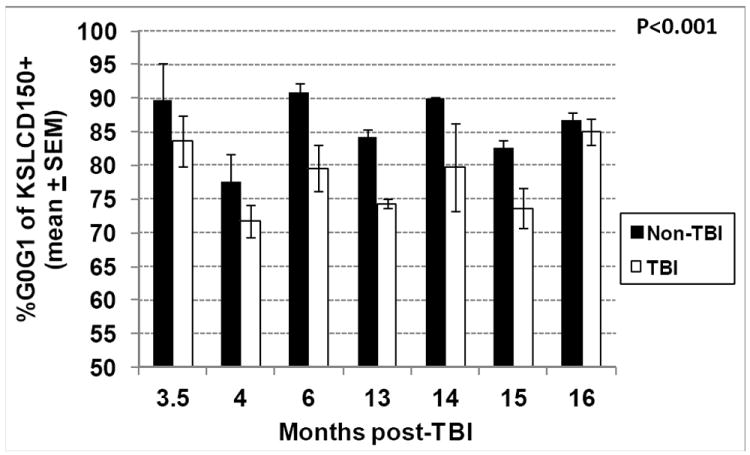
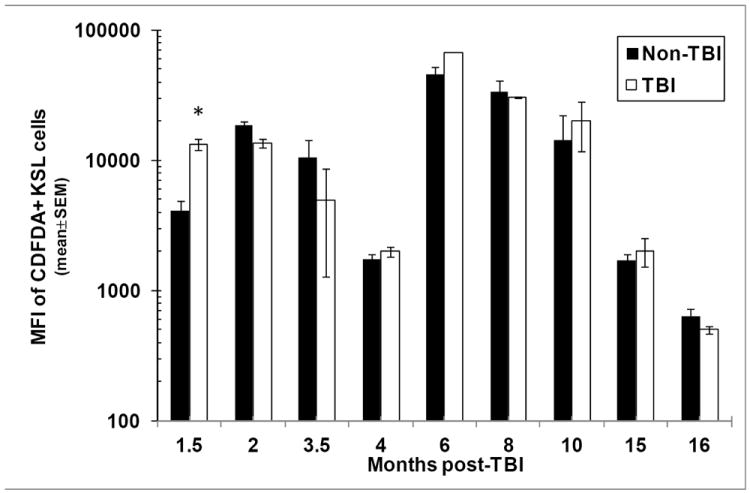
Residual bone marrow damage (RBMD) persists for years following exposure to radiation and is believed to be due to decreased self-renewal potential of radiation-damaged hematopoietic stem cells (HSC). Current literature has examined primarily sublethal doses of radiation and time points within a few months of exposure. In this study, the authors examined RBMD in mice surviving lethal doses of total body ionizing irradiation (TBI) in a murine model of the Hematopoietic Syndrome of the Acute Radiation Syndrome (H-ARS). Survivors were analyzed at various time points up to 19 mo post-TBI for hematopoietic function. The competitive bone marrow (BM) repopulating potential of 150 purified c-Kit+ Sca-1+ lineage- CD150+ cells (KSLCD150+) remained severely deficient throughout the study compared to KSLCD150+ cells from non-TBI age-matched controls. The minimal engraftment from these TBI HSCs is predominantly myeloid, with minimal production of lymphocytes both in vitro and in vivo. All classes of blood cells as well as BM cellularity were significantly decreased in TBI mice, especially at later time points as mice aged. Primitive BM hematopoietic cells (KSLCD150+) displayed significantly increased cell cycling in TBI mice at all time points, which may be a physiological attempt to maintain HSC numbers in the post-irradiation state. Taken together, these data suggest that the increased cycling among primitive hematopoietic cells in survivors of lethal radiation may contribute to long-term HSC exhaustion and subsequent RBMD, exacerbated by the added insult of aging at later time points.


Conflict of interest statement

No financial conflict of interest was declared by any of the authors.

Figures

Figure 1
Figure 1. Body weight and CBC profiles in TBI and non-TBI mice
At various times between 1.5 and 19 months post-exposure, TBI and non-TBI mice were assessed for body weight (panel a), peripheral blood white blood cells (WBC, panel b), neutrophils (NE, panel c), lymphocytes (LY, panel d), red blood cells (RBC, panel e), and platelets (PLT, panel f). Lines represent mean±SEM; *p≤0.01 comparing non-TBI to TBI, **p<0.05 for significant interaction indicating greater difference between TBI and non-TBI at later time points. n=2-3 mice per group per time point.
Figure 2
Figure 2. Bone marrow (BM) cellularity and primitive hematopoietic phenotypes in TBI and non-TBI mice
TBI and non-TBI mice were sacrificed at various times post-exposure and LDBM isolated. LDBM was enumerated and absolute numbers of LDBM cells per mouse (BM cellularity) were calculated as described in Materials and Methods (panel a). The percentage of different primitive hematopoietic cell phenotypes was determined by flow cytometry as described in Materials and Methods, and multiplied by BM cellularity in panel a to give the absolute number of these different cells per mouse. The following data are shown: panel b, the percentage of lineage-negative cells; panel c, the absolute number of lineage-negative cells per mouse; panel d, the percentage of Sca-1+ c-Kit+ cells on lin- cells; panel e, the absolute number of KSL per mouse; panel f, the percentage of KSLCD150+ cells; panel g, the absolute number of KSLCD150+ cells per mouse; panel h, the percentage of CD150+ cells within the KSL population. Phenotyping of bone marrow cells at month 19 post-TBI could not be performed due to limiting numbers of cells isolated at this time point. Bars represent mean±SEM; p values comparing non-TBI to TBI are given on each figure. n=3 mice per group per time point.
Figure 3
Figure 3. Hematopoietic and pre-B lymphoid progenitors in TBI and non-TBI mouse BM
1.0 × 10⁵ LDBM from TBI and non-TBI mice isolated between 1.5 and 19 months post-exposure was suspended in duplicate in 1 mL methylcellulose media containing muSCF, muIL-3, rhuIL-6, and rhuEPO (for hematopoietic progenitors), or in 1 mL methylcellulose media containing recombinant human IL-7 (for pre-B lymphoid colonies). Cells were incubated in 100% humidified 5% CO2 in air at 37°C and enumerated 13 days later for CFU-GM, BFU-E, and CFU-GEMM colonies, or 7 days later for pre-B lymphoid colonies. The frequency of CFU-GM, BFU-E, and CFU-GEMM combined and total number of these per mouse are shown in panels a and b, respectively. Panels c and d give the frequency and total number of pre-B lymphoid colonies per mouse, respectively. Bars represent mean±SEM; p values comparing non-TBI to TBI are given on each figure. n=1-3 mice per group per time point.
Figure 4
Figure 4. Long term engraftment potential of TBI and non-TBI HSC in competitive transplantation assays
Lethally irradiated congenic murine recipients were transplanted with 150 KSLCD150+ cells isolated from either TBI or non-TBI donors, along with 1.0 × 10⁵ LDBM competitor cells of congenic origin. Peripheral blood from tail snips was obtained from transplanted recipients at monthly intervals and was analyzed by flow cytometry to determine donor chimerism using antibodies against CD45.1 and CD45.2. Lines represent mean±SEM donor chimerism at 6 months post-transplant (except data at months 3.5, 15 and 16, which represent chimerism in ongoing experiments analyzed at 4, 3 and 2 months post-transplant, respectively). *p<0.001 comparing non-TBI to TBI, n=4-14 recipient mice per group per time point.
Figure 5
Figure 5. Lineage reconstitution of TBI and non-TBI HSC in competitive transplantation assays
Mice transplanted with TBI or non-TBI KSLCD150+ cells in Figure 4 were assayed for donor-derived lineage reconstitution at 6 months post-transplantation. Peripheral blood from tail snips was stained with fluorescently tagged antibodies to CD45.1, CD45.2, CD4, CD8, B220, and Gr1, and analyzed by flow cytometry for donor- or competitor-derived CD4+ and CD8+ T cells, B cells, and granulocytes. Panel a depicts the lineage reconstitution of 150 KSLCD150+ cells from TBI donors (expressed as a percentage of total TBI donor cells). Data on months 2, 8, and 10 in Panel a were n=1 since mice transplanted with TBI KSLCD150+ cells often did not exhibit high enough donor chimerism to allow further phenotyping for lineage cells. Panel b shows the lineage reconstitution of 150 KSLCD150+ cells from non-TBI donors (expressed as a percentage of total non-TBI donor cells). Panels c and d show the lineage reconstitution by the congenic competitor cells (expressed as a percentage of total competitor cells) that were co-transplanted with KSLCD150+ from TBI or non-TBI donors, respectively, which acts as an internal standard for normal lineage reconstitution. Bars represent mean±SEM; n=1-7 recipient mice per group per time point.
Figure 6
Figure 6. Cell cycle analysis of TBI and non-TBI HSC
TBI and non-TBI mice were sacrificed at various times between 3.5 and 16 months post-exposure and bone marrow KSLCD150+ cells were analyzed by flow cytometry for cell cycle position using the DNA stain DAPI. Bars represent mean±SEM; *p<0.001 comparing non-TBI to TBI, n=3 mice per group per time point.
Figure 7
Figure 7. Content of reactive oxygen species (ROS) in TBI and non-TBI bone marrow KSL cells
TBI and non-TBI mice were sacrificed at various times between 1.5 and 16 months post-exposure and bone marrow KSL cells were analyzed by flow cytometry for ROS content using C-DFDA. Bars represent the mean±SEM of the mean fluorescence intensity (MFI) of C-DFDA on C-DFDA+ KSL cells; *p<0.05 comparing TBI and non-TBI C-DFDA+ KSL cells at 1.5 months post-exposure. n=2-3 mice per group per time point.

References

    1. Abramson S, Miller RG, Phillips RA. The identification in adult bone marrow of pluripotent and restricted stem cells of the myeloid and lymphoid systems. Journal of Experimental Medicine. 1977;145:1567. - PMC - PubMed
    1. Belkacemi Y, Bouchet S, Frick J, Huchet A, Pene F, Aigueperse J, Gourmelon P, Lopez M, Gorin NC. Monitoring of residual hematopoiesis after total body irradiation in humans as a model for accidental x-ray exposure: dose-effect and failure of ex vivo expansion of residual stem cells in view of autografting. Int J Radiat Oncol Biol Phys. 2003;57:500–7. - PubMed
    1. Boggs D. The total marrow mass of the mouse: A simplified method of measurement. Am J Hematol. 1984;16:277–286. - PubMed
    1. Botnick LE, Hannon EC, Hellman S. A long lasting proliferative defect in the hematopoietic stem cell compartment following cytotoxic agents. Int J Radiat Oncol Biol Phys. 1979;5:1621–5. - PubMed
    1. Carsten A, Bond V. CFU content of the x-ray exposed and shielded mouse femur. Exptl Hematology. 1968;15:95–103.

Publication types