. 2012:8:606.
doi: 10.1038/msb.2012.39.

Systems-based analysis of Arabidopsis leaf growth reveals adaptation to water deficit

Affiliations

Systems-based analysis of Arabidopsis leaf growth reveals adaptation to water deficit

Katja Baerenfaller et al. Mol Syst Biol. 2012.

Abstract

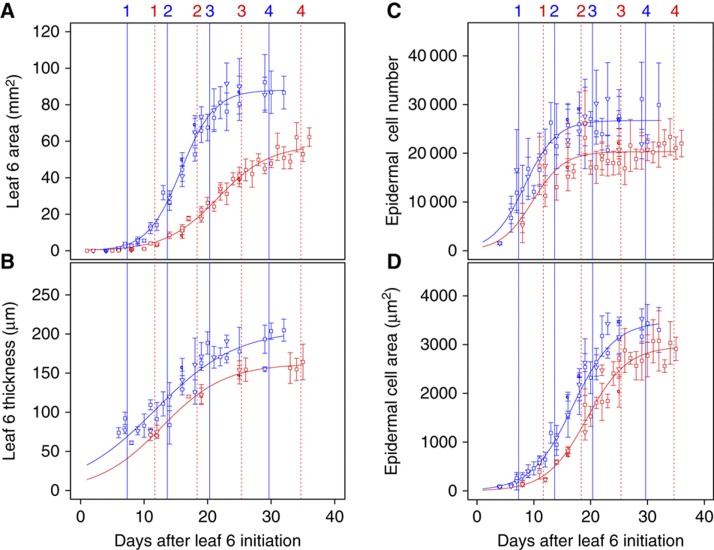
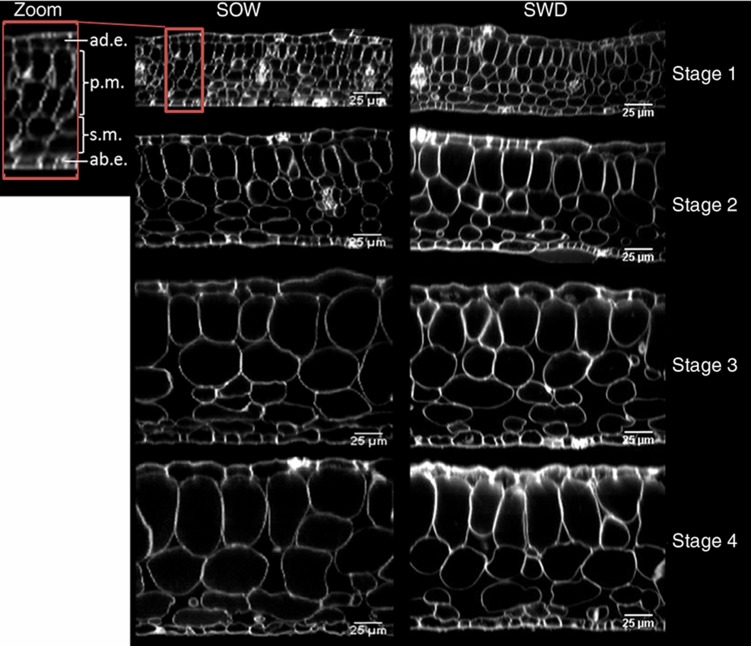
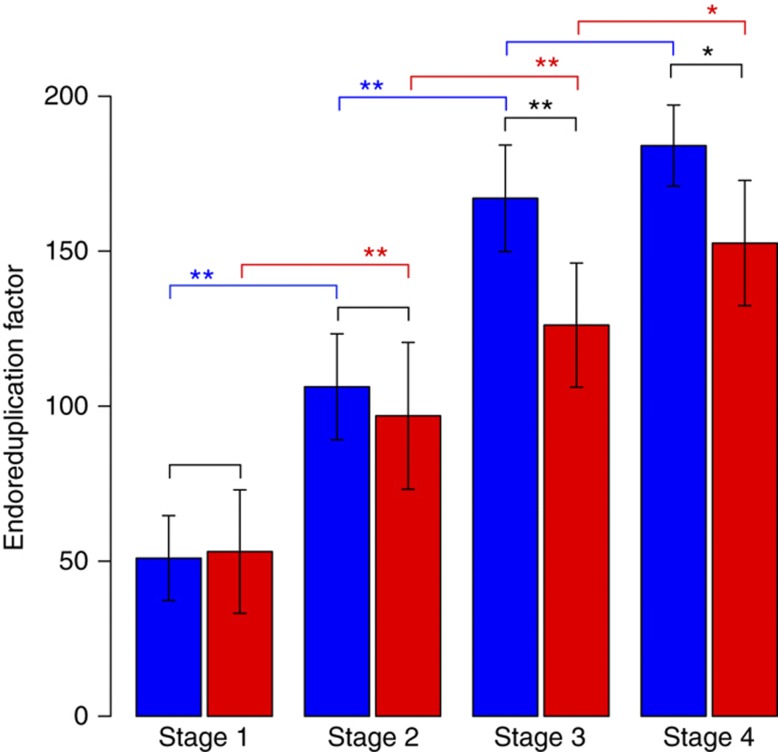
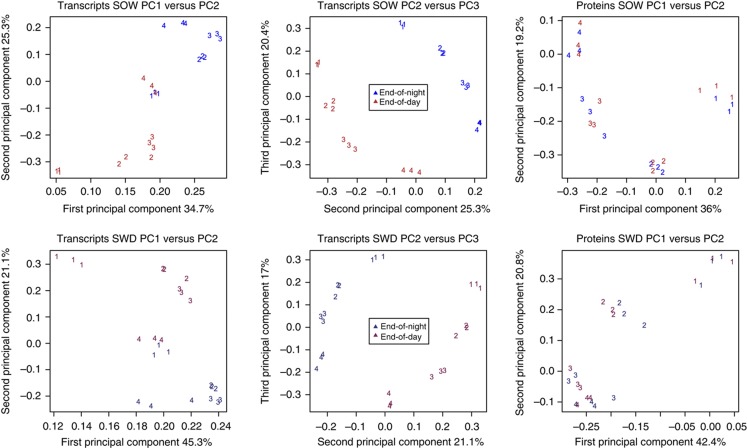
Leaves have a central role in plant energy capture and carbon conversion and therefore must continuously adapt their development to prevailing environmental conditions. To reveal the dynamic systems behaviour of leaf development, we profiled Arabidopsis leaf number six in depth at four different growth stages, at both the end-of-day and end-of-night, in plants growing in two controlled experimental conditions: short-day conditions with optimal soil water content and constant reduced soil water conditions. We found that the lower soil water potential led to reduced, but prolonged, growth and an adaptation at the molecular level without a drought stress response. Clustering of the protein and transcript data using a decision tree revealed different patterns in abundance changes across the growth stages and between end-of-day and end-of-night that are linked to specific biological functions. Correlations between protein and transcript levels depend on the time-of-day and also on protein localisation and function. Surprisingly, only very few of >1700 quantified proteins showed diurnal abundance fluctuations, despite strong fluctuations at the transcript level.


Conflict of interest statement

The authors declare that they have no conflict of interest.

Figures

Figure 1
Figure 1
Growth phenotypes of leaves harvested for profiling. Kinematic expansion phenotypes of leaves in the SOW (blue) and SWD (red) experiments. Each symbol represents an independent experiment. Leaf 6 changed over time in area (A), thickness (B), epidermal cell number (C) and epidermal cell area (D). Data are presented as mean and s.d. values, n=5. The numbers at the top of the graphs indicate the four growth stages. Source data is available for this figure in the Supplementary Information.
Figure 2
Figure 2
Transversal sections of leaves across development in SOW and SWD. Sections of leaf 6 in SOW (left panels) and SWD (right panels) were imaged with biphotonic microscopy at the four stages. Tissue layers are marked in the left side zoom section: ad.e.=adaxial epidermis, p.m.=palisade mesophyll, s.m.=spongy mesophyll, ab.e.=abaxial epidermis. Scale bars indicate 25 μm.
Figure 3
Figure 3
Endoreduplication during leaf development. Endoreduplication factors were calculated and compared for the four development stages in SOW (blue) and SWD (red). Graphs show mean and s.d. values, n≥5; ** indicates statistical significance at level P<0.01, and * at level P<0.05 (two-sided Welch test). Source data is available for this figure in the Supplementary Information.
Figure 4
Figure 4
PCA of transcript and protein profiles. Upper and lower panels show SOW (upper panels) and SWD (lower panels) experiments, respectively.
Figure 5
Figure 5
Clustering of transcript and protein profiles with a decision tree. The clustering of the regulated proteins and transcripts into 87 theoretical patterns was done according to the results of the ANOVA. First, the difference between the subsequent stages (stages 1–4=S1–S4) was tested for increasing (orange) or decreasing (green) levels or no significant change (grey). For pattern E-E-E, the difference between stages 1 and 4 was also tested and the E-E-E replaced accordingly with ‘U’, ‘E’ or ‘D’. Then, the difference between EON and EOD was tested for levels higher at EOD (‘ED’, red) or EON (‘EN’, blue) or no significant change (‘E’, grey). Displayed is the subtree for patterns with ‘E’ after the first decision and the full tree is available in Supplementary Figure 3.
Figure 6
Figure 6
Example transcript and protein patterns. (A) Transcripts in patterns U-E-U-EN and E-ED and (B) proteins in patterns D-E and U-U-E-E. For each transcript or protein in the respective pattern, the mean sample/reference ratios in the eight time points (stages 1–4=S1–S4, EON=EN, EOD=ED) are shown and connected with grey lines. At each time point, a boxplot using Tukey’s standard definition illustrates the distribution of the ratios. The blue line depicts the stage differences by connecting the means between the EOD and EON samples for each stage and the red lines the EOD and EON differences at each stage.
Figure 7
Figure 7
Stage-dependent diurnal transcript changes. (A) The number of transcripts changing between end-of-day and end-of-night with an adjusted P-value<0.05 in each of the four growth stages. In each stage, the first bar indicates the transcripts that change only in the optimal water experiment, the second bar those that change in both optimal water and water deficit, and in the third bar those that only change in water deficit. The transcripts that are higher at EON are indicated in blue and those at EOD in red. (B) Venn diagram of the stage-dependent diurnal changes in SOW and (C) in SWD. For the transcripts that show diurnal changes only in one stage, the percentage with regard to all transcripts changing in that stage is given.
Figure 8
Figure 8
Correlation of protein and transcript patterns across growth stages. The number of protein–transcript pairs that fall into the respective protein and transcript pattern combinations are given for the protein–transcript pairs in which both the protein and the transcript were changing significantly between the eight time points in the optimal water experiment. Yellow: identical patterns, bright yellow: similar trends, red: opposite trends.

References

    1. Achard P, Cheng H, Grauwe LD, Decat J, Schoutteten H, Moritz T, Straeten DVD, Peng J, Harberd NP (2006) Integration of plant responses to environmentally activated phytohormonal signals. Science 311: 91–94 - PubMed
    1. Aguirrezabal L, Bouchier-Combaud S, Radziejwoski A, Dauzat M, Cookson SJ, Granier C (2006) Plasticity to soil water deficit in Arabidopsis thaliana: dissection of leaf development into underlying growth dynamic and cellular variables reveals invisible phenotypes. Plant Cell Environ 29: 2216–2227 - PubMed
    1. Alabadí D, Oyama T, Yanovsky MJ, Harmon FG, Más P, Kay SA (2001) Reciprocal regulation between TOC1 and LHY/CCA1 within the Arabidopsis circadian clock. Science 293: 880–883 - PubMed
    1. Alexa A, Rahnenfuhrer J, Lengauer T (2006) Improved scoring of functional groups from gene expression data by decorrelating GO graph structure. Bioinformatics 22: 1600–1607 - PubMed
    1. Anastasiou E, Lenhard M (2007) Growing up to one’s standard. Curr Opin Plant Biol 10: 63–69 - PubMed

Publication types