

Imaging biomarker dynamics in an intracranial murine glioma study of radiation and antiangiogenic therapy
- PMID: 22929856
- PMCID: PMC8366682
- DOI: 10.1016/j.ijrobp.2012.07.005
Imaging biomarker dynamics in an intracranial murine glioma study of radiation and antiangiogenic therapy
Abstract
Purpose: There is a growing need for noninvasive biomarkers to guide individualized spatiotemporal delivery of radiation therapy (RT) and antiangiogenic (AA) therapy for brain tumors. This study explored early biomarkers of response to RT and the AA agent sunitinib (SU), in a murine intracranial glioma model, using serial magnetic resonance imaging (MRI).
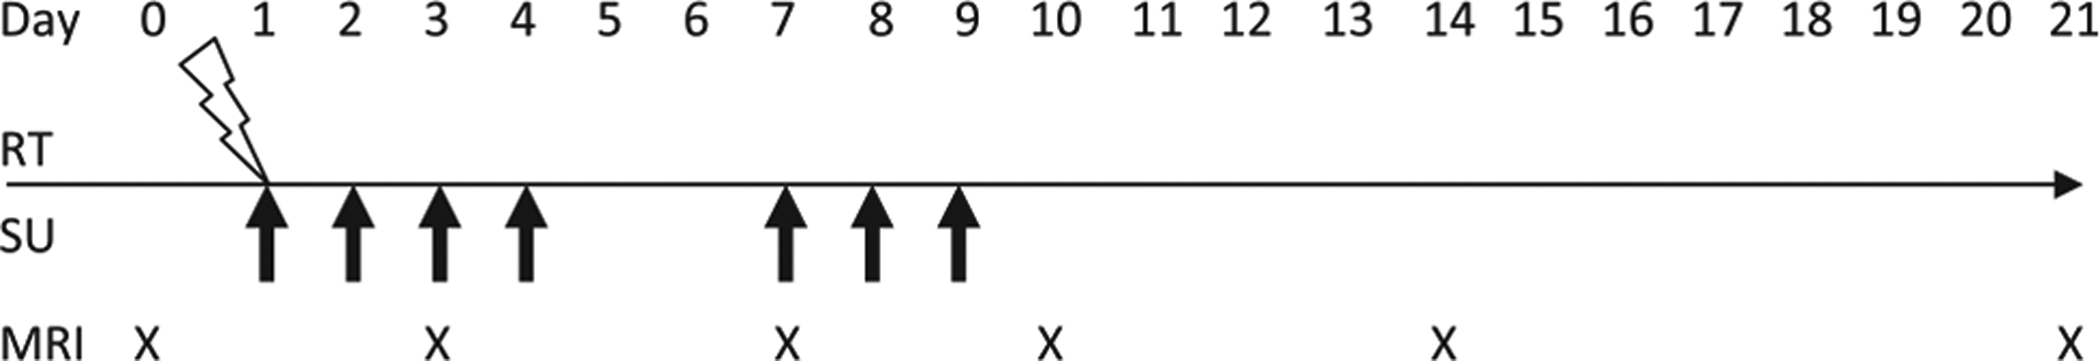
Methods and materials: Mice with MRI-visible tumors were stratified by tumor size into 4 therapy arms: control, RT, SU, and SU plus RT (SURT). Single-fraction conformal RT was delivered using MRI and on-line cone beam computed tomography (CT) guidance. Serial MR images (T2-weighted, diffusion, dynamic contrast-enhanced and gadolinium-enhanced T1-weighted scans) were acquired biweekly to evaluate tumor volume, apparent diffusion coefficient (ADC), and tumor perfusion and permeability responses (K(trans), K(ep)).
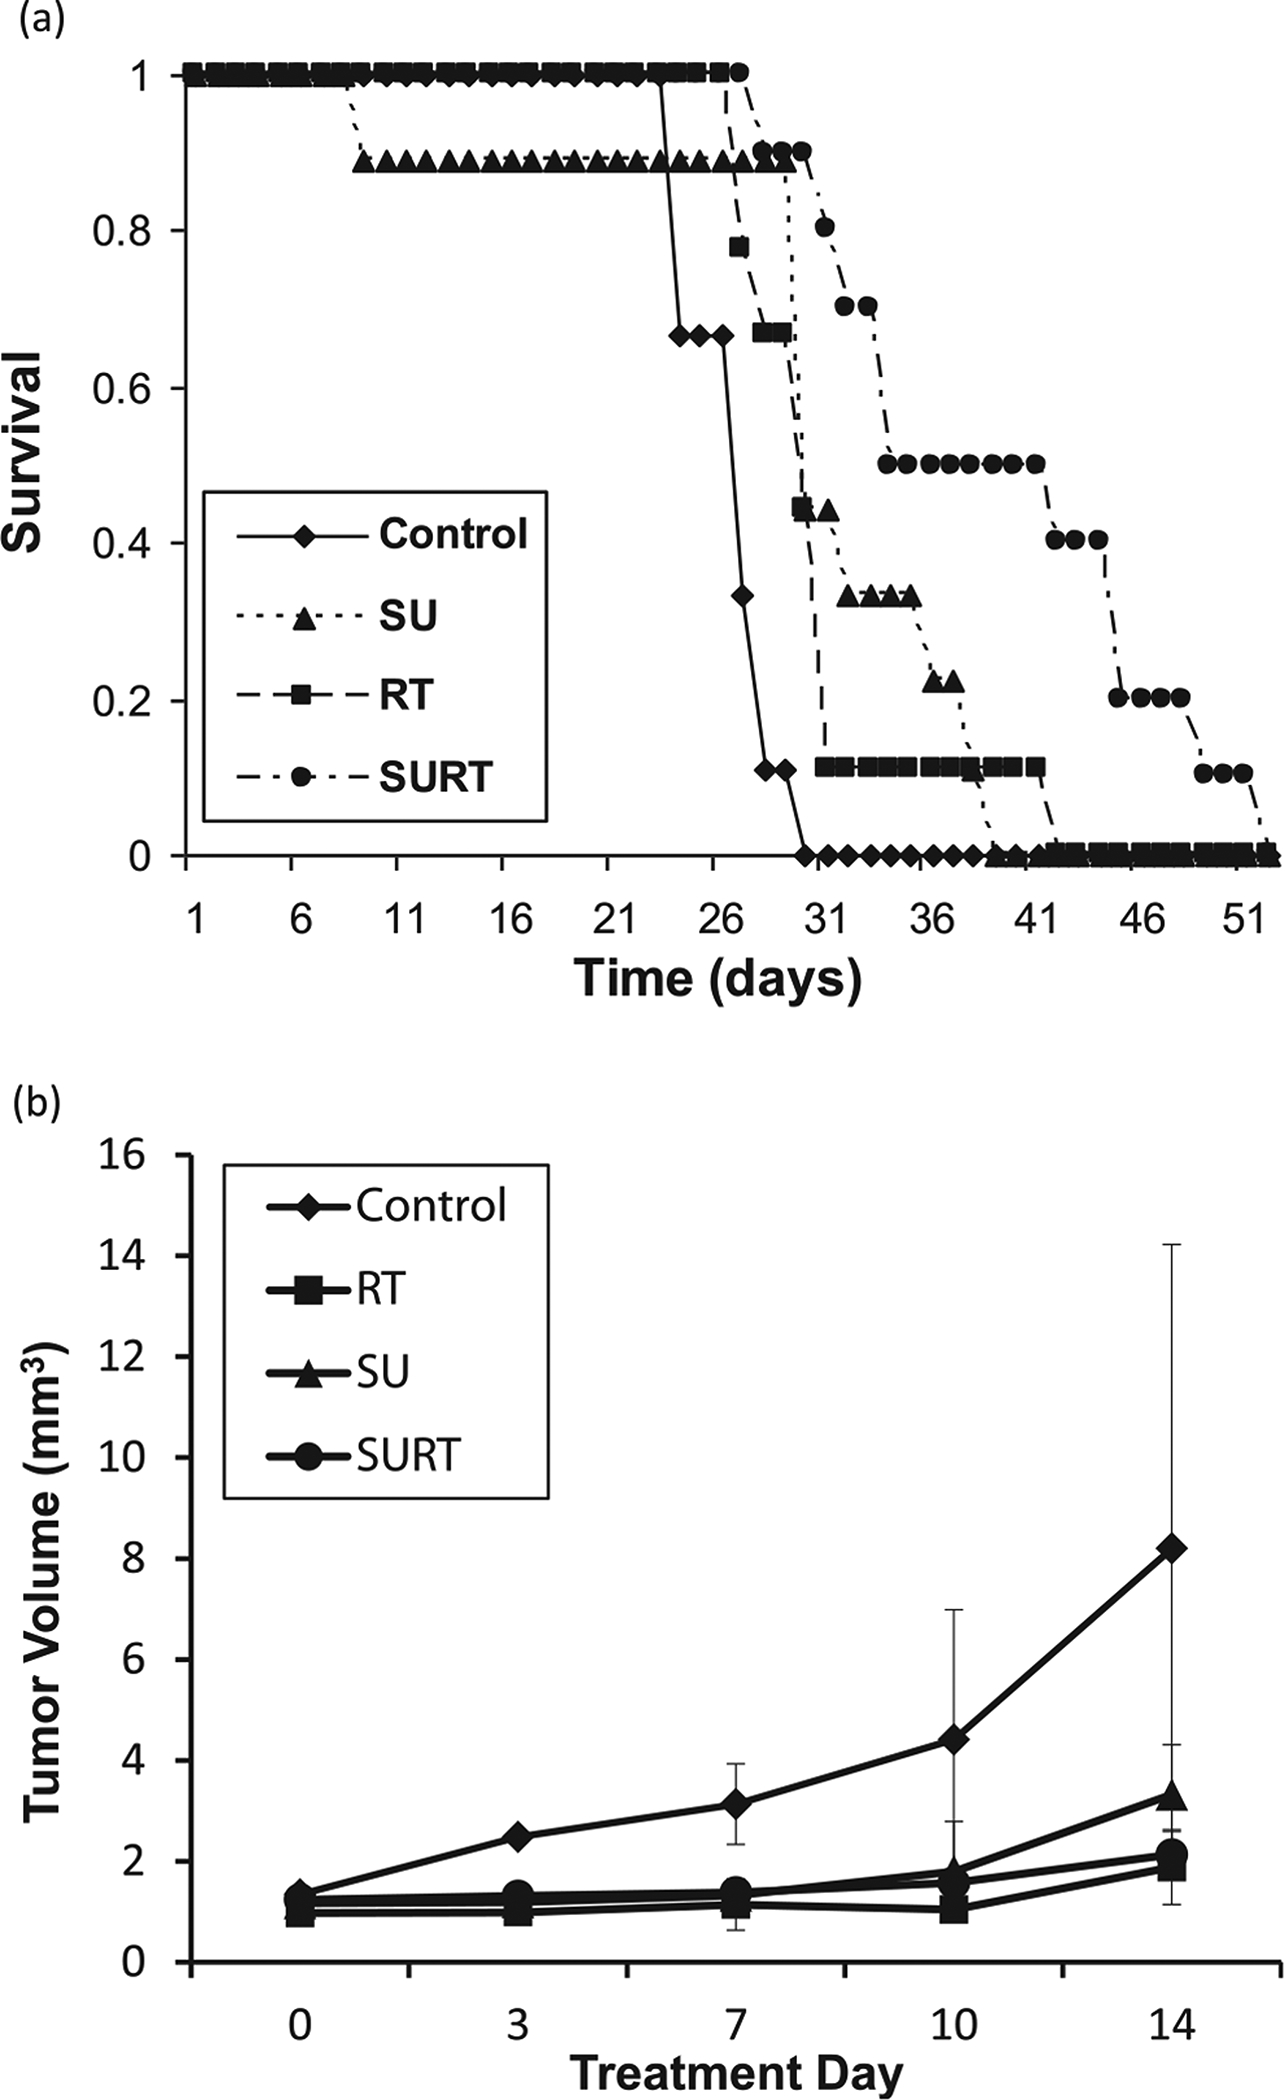
Results: Mice in all treatment arms survived longer than those in control, with a median survival of 35 days for SURT (P<.0001) and 30 days for RT (P=.009) and SU (P=.01) mice vs 26 days for control mice. At Day 3, ADC rise was greater with RT than without (P=.002). Sunitinib treatment reduced tumor perfusion/permeability values with mean K(trans) reduction of 27.6% for SU (P=.04) and 26.3% for SURT (P=.04) mice and mean K(ep) reduction of 38.1% for SU (P=.01) and 27.3% for SURT (P=.02) mice. The magnitude of individual mouse ADC responses at Days 3 and 7 correlated with subsequent tumor growth rate R values of -0.878 (P=.002) and -0.80 (P=.01), respectively.
Conclusions: Early quantitative changes in diffusion and perfusion MRI measures reflect treatment responses soon after starting therapy and thereby raise the potential for these imaging biomarkers to guide adaptive and potentially individualized therapy approaches in the future.
Copyright © 2013 Elsevier Inc. All rights reserved.
Conflict of interest statement
Conflict of interest: the drug sunitinib was provided by Pfizer for this study.
Figures


References
-
- Jain RK. Normalization of tumor vasculature: an emerging concept in antiangiogenic therapy. Science 2005;307:58–62. - PubMed
-
- Citrin D, Menard C, Camphausen K. Combining radiotherapy and angiogenesis inhibitors: clinical trial design. Int J Radiat Oncol Biol Phys 2006;64:15–25. - PubMed
-
- Schuuring J, Bussink J, Bernsen HJ, et al.Irradiation combined with SU5416: microvascular changes and growth delay in a human xenograft glioblastoma tumor line. Int J Radiat Oncol Biol Phys 2005;61:529–534. - PubMed
-
- Chenevert TL, McKeever PE, Ross BD. Monitoring early response of experimental brain tumors to therapy using diffusion magnetic resonance imaging. Clin Cancer Res 1997;3:1457–1466. - PubMed
Publication types
MeSH terms
Substances
Grants and funding
LinkOut - more resources
Full Text Sources
Other Literature Sources
Medical
