Towards a comprehensive picture of the genetic landscape of complex traits
- PMID: 22930650
- PMCID: PMC3896925
- DOI: 10.1093/bib/bbs049
Towards a comprehensive picture of the genetic landscape of complex traits
Abstract
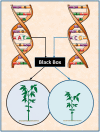
The formation of phenotypic traits, such as biomass production, tumor volume and viral abundance, undergoes a complex process in which interactions between genes and developmental stimuli take place at each level of biological organization from cells to organisms. Traditional studies emphasize the impact of genes by directly linking DNA-based markers with static phenotypic values. Functional mapping, derived to detect genes that control developmental processes using growth equations, has proven powerful for addressing questions about the roles of genes in development. By treating phenotypic formation as a cohesive system using differential equations, a different approach-systems mapping-dissects the system into interconnected elements and then map genes that determine a web of interactions among these elements, facilitating our understanding of the genetic machineries for phenotypic development. Here, we argue that genetic mapping can play a more important role in studying the genotype-phenotype relationship by filling the gaps in the biochemical and regulatory process from DNA to end-point phenotype. We describe a new framework, named network mapping, to study the genetic architecture of complex traits by integrating the regulatory networks that cause a high-order phenotype. Network mapping makes use of a system of differential equations to quantify the rule by which transcriptional, proteomic and metabolomic components interact with each other to organize into a functional whole. The synthesis of functional mapping, systems mapping and network mapping provides a novel avenue to decipher a comprehensive picture of the genetic landscape of complex phenotypes that underlie economically and biomedically important traits.
Keywords: DNA polymorphism; complex traits; differential equations; network mappin; systems biology.
Figures


Similar articles
-
Mapping complex traits as a dynamic system.Phys Life Rev. 2015 Jun;13:155-85. doi: 10.1016/j.plrev.2015.02.007. Epub 2015 Feb 20. Phys Life Rev. 2015. PMID: 25772476 Free PMC article. Review.
-
Systems mapping: how to improve the genetic mapping of complex traits through design principles of biological systems.BMC Syst Biol. 2011 May 27;5:84. doi: 10.1186/1752-0509-5-84. BMC Syst Biol. 2011. PMID: 21615967 Free PMC article.
-
Structural mapping: how to study the genetic architecture of a phenotypic trait through its formation mechanism.Brief Bioinform. 2014 Jan;15(1):43-53. doi: 10.1093/bib/bbs067. Epub 2012 Oct 25. Brief Bioinform. 2014. PMID: 23104859
-
Genetic architecture of growth traits in Populus revealed by integrated quantitative trait locus (QTL) analysis and association studies.New Phytol. 2016 Feb;209(3):1067-82. doi: 10.1111/nph.13695. Epub 2015 Oct 26. New Phytol. 2016. PMID: 26499329
-
Moving toward a system genetics view of disease.Mamm Genome. 2007 Jul;18(6-7):389-401. doi: 10.1007/s00335-007-9040-6. Epub 2007 Jul 26. Mamm Genome. 2007. PMID: 17653589 Free PMC article. Review.
Cited by
-
Delivering systems pharmacogenomics towards precision medicine through mathematics.Adv Drug Deliv Rev. 2013 Jun 30;65(7):905-11. doi: 10.1016/j.addr.2013.03.002. Epub 2013 Mar 22. Adv Drug Deliv Rev. 2013. PMID: 23523629 Free PMC article. Review.
-
Stochastic modeling of systems mapping in pharmacogenomics.Adv Drug Deliv Rev. 2013 Jun 30;65(7):912-7. doi: 10.1016/j.addr.2013.03.004. Epub 2013 Mar 22. Adv Drug Deliv Rev. 2013. PMID: 23528445 Free PMC article.
-
Mapping complex traits as a dynamic system.Phys Life Rev. 2015 Jun;13:155-85. doi: 10.1016/j.plrev.2015.02.007. Epub 2015 Feb 20. Phys Life Rev. 2015. PMID: 25772476 Free PMC article. Review.
-
A bi-Poisson model for clustering gene expression profiles by RNA-seq.Brief Bioinform. 2014 Jul;15(4):534-41. doi: 10.1093/bib/bbt029. Brief Bioinform. 2014. PMID: 23665510 Free PMC article.
-
MVQTLCIM: composite interval mapping of multivariate traits in a hybrid F1 population of outbred species.BMC Bioinformatics. 2017 Nov 23;18(1):515. doi: 10.1186/s12859-017-1908-1. BMC Bioinformatics. 2017. PMID: 29169342 Free PMC article.
References
-
- Frazer KA, Murray SS, Schork NJ, et al. Human genetic variation and its contribution to complex traits. Nat Rev Genet. 2009;10:241–51. - PubMed
-
- Mackay TF, Stone EA, Ayorles JF. The genetics of quantitative traits: challenges and prospects. Nat Rev Genet. 2009;10:565–77. - PubMed
-
- Miura K, Ashikari M, Matsuoka M. The role of QTLs in the breeding of high-yielding rice. Trends Plant Sci. 2012;16:319–26. - PubMed

