

Control of adaptive immune responses by Staphylococcus aureus through IL-10, PD-L1, and TLR2
- PMID: 22930672
- PMCID: PMC3428601
- DOI: 10.1038/srep00606
Control of adaptive immune responses by Staphylococcus aureus through IL-10, PD-L1, and TLR2
Abstract
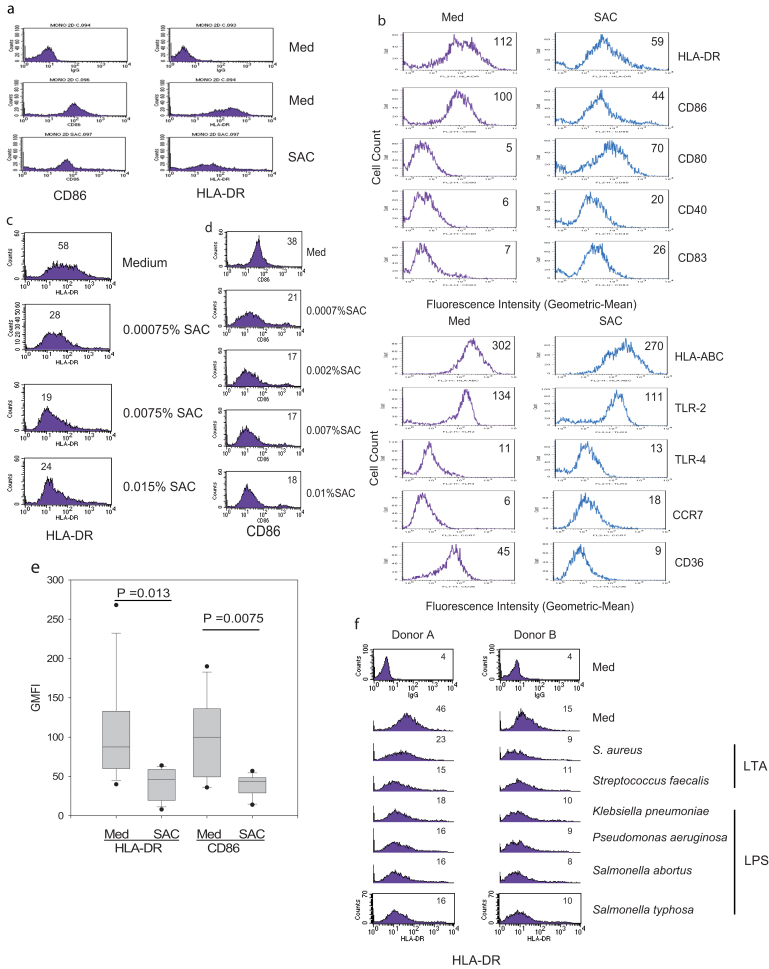
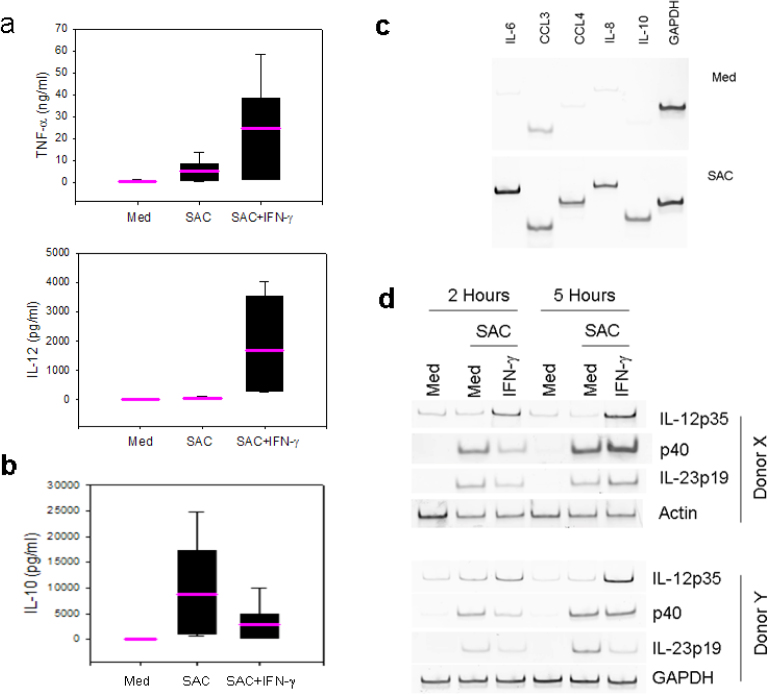
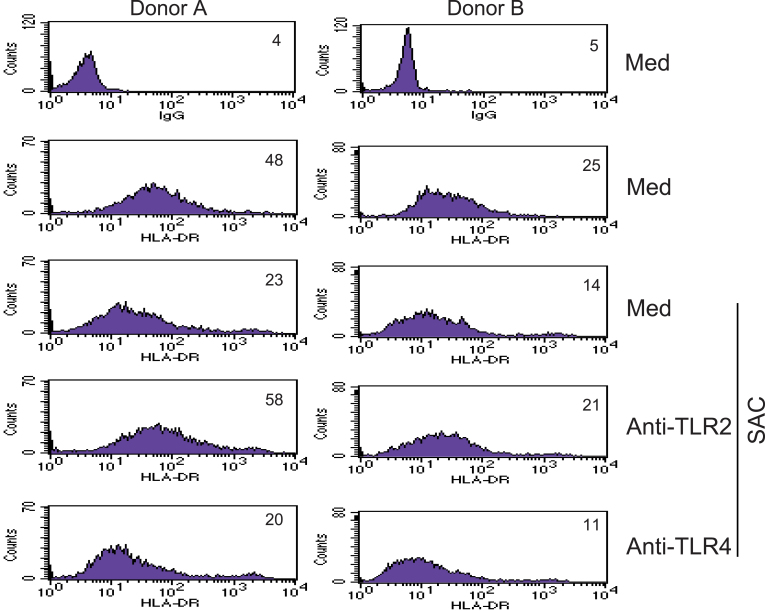
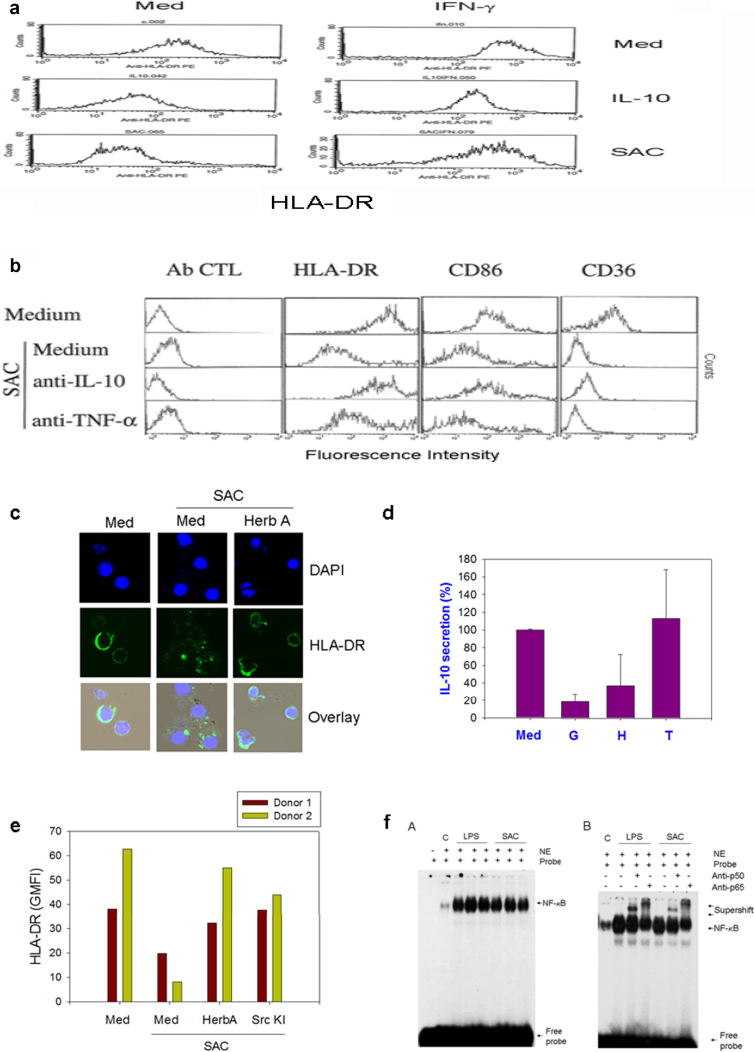
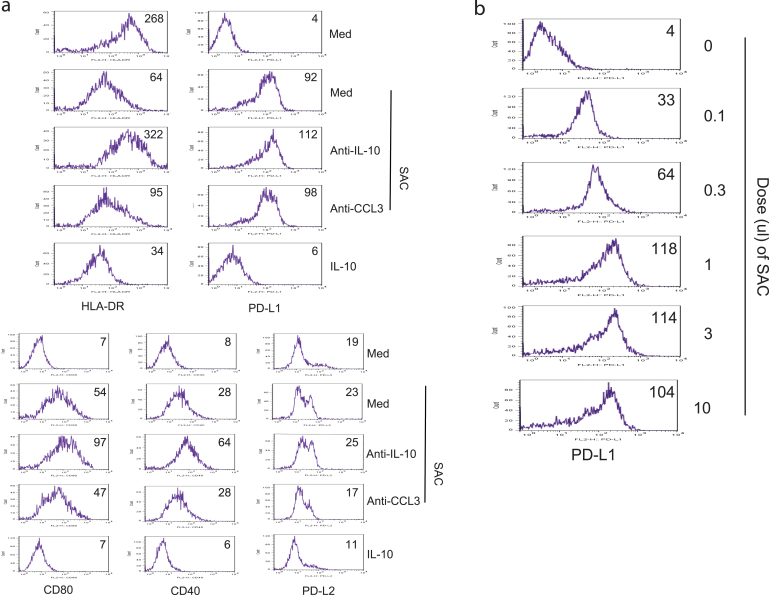
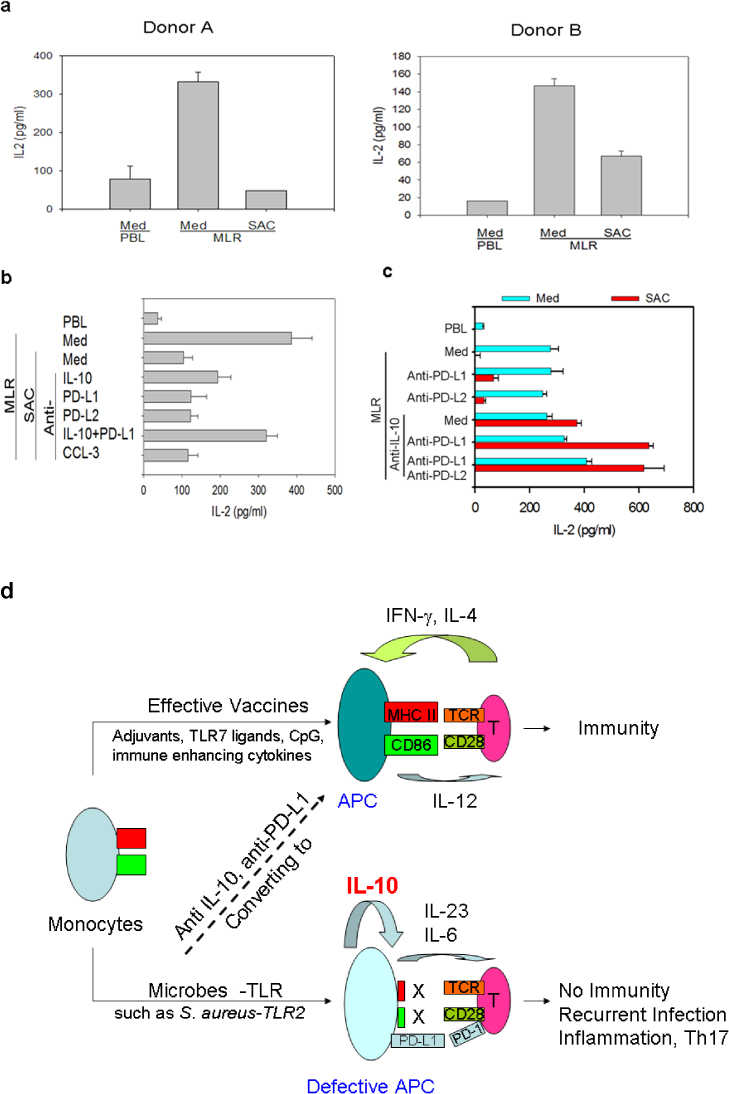
Microbes induce innate immune responses in hosts. It is critical to know how different microbes control adaptive responses through innate pathways. The impact of gram-positive bacteria on the innate and adaptive responses is unclear. Herein we report that Staphylococcus aureus induces IL-10, Th17-inducing cytokines IL-6 and IL-23, chemokines, and regulates dendritic cell markers. S. aureus inhibits T-cell IL-2 responses through modulation of HLA-DR, CD86 and PD-L1. IFN-gamma, Src kinase inhibitors, or TLR2 antibodies prevented the down-modulation of HLA-DR by S. aureus. Our data demonstrate that innate TLR signaling induces multi-dimensional inhibition of adaptive immune responses, which may contribute to the lack of protective immunity to bacteria or microbe tolerance. IL-10 and PD-L1 antagonists may boost immunity to vaccines for S. aureus and other microbes.
Figures
Similar articles
-
A modulatory interleukin-10 response to staphylococcal peptidoglycan prevents Th1/Th17 adaptive immunity to Staphylococcus aureus.J Infect Dis. 2011 Jul 15;204(2):253-62. doi: 10.1093/infdis/jir276. J Infect Dis. 2011. PMID: 21673036
-
Dual regulation of osteopontin production by TLR stimulation in dendritic cells.J Leukoc Biol. 2013 Jul;94(1):147-58. doi: 10.1189/jlb.0412194. Epub 2013 Apr 22. J Leukoc Biol. 2013. PMID: 23610145
-
Induction of IL-10-balanced immune profiles following exposure to LTA from Staphylococcus epidermidis.Exp Dermatol. 2018 Apr;27(4):318-326. doi: 10.1111/exd.13540. Exp Dermatol. 2018. PMID: 29569765
-
Outer membrane protein A (OmpA) of Shigella flexneri 2a links innate and adaptive immunity in a TLR2-dependent manner and involvement of IL-12 and nitric oxide.J Biol Chem. 2012 Apr 6;287(15):12589-601. doi: 10.1074/jbc.M111.335554. Epub 2012 Feb 16. J Biol Chem. 2012. Retraction in: J Biol Chem. 2020 Feb 21;295(8):2543. doi: 10.1074/jbc.W120.012819. PMID: 22343631 Free PMC article. Retracted.
-
Forkhead Box O1 Regulates Macrophage Polarization Following Staphylococcus aureus Infection: Experimental Murine Data and Review of the Literature.Clin Rev Allergy Immunol. 2016 Dec;51(3):353-369. doi: 10.1007/s12016-016-8531-1. Clin Rev Allergy Immunol. 2016. PMID: 26924010 Review.
Cited by
-
Antibiotics Differentially Modulate Lipoteichoic Acid-Mediated Host Immune Response.Antibiotics (Basel). 2020 Sep 3;9(9):573. doi: 10.3390/antibiotics9090573. Antibiotics (Basel). 2020. PMID: 32899240 Free PMC article.
-
Microbe-Mediated Activation of Toll-like Receptor 2 Drives PDL1 Expression in HNSCC.Cancers (Basel). 2021 Sep 24;13(19):4782. doi: 10.3390/cancers13194782. Cancers (Basel). 2021. PMID: 34638266 Free PMC article.
-
Intracellular Pathogens: Host Immunity and Microbial Persistence Strategies.J Immunol Res. 2019 Apr 14;2019:1356540. doi: 10.1155/2019/1356540. eCollection 2019. J Immunol Res. 2019. PMID: 31111075 Free PMC article. Review.
-
Retrospective Identification of a Broad IgG Repertoire Differentiating Patients With S. aureus Skin and Soft Tissue Infections From Controls.Front Immunol. 2019 Feb 7;10:114. doi: 10.3389/fimmu.2019.00114. eCollection 2019. Front Immunol. 2019. PMID: 30792711 Free PMC article.
-
PD-L1 limits the mucosal CD8+ T cell response to Chlamydia trachomatis.J Immunol. 2014 Feb 1;192(3):1079-90. doi: 10.4049/jimmunol.1301657. Epub 2013 Dec 18. J Immunol. 2014. PMID: 24353266 Free PMC article.
References
-
- Lowy F. D. Staphylococcus aureus infections. N. Engl. J. Med. 339, 520–532 (1998). - PubMed
-
- Takeuchi O. et al. Differential roles of TLR2 and TLR4 in recognition of gram-negative and gram-positive bacterial cell wall components. Immunity. 11, 443–451 (1999). - PubMed
-
- Takeuchi O., Hoshino K. & Akira S. Cutting edge: TLR2-deficient and MyD88-deficient mice are highly susceptible to Staphylococcus aureus infection. J Immunol. 165, 5392–5396 (2000). - PubMed
-
- Kawai T., Adachi O., Ogawa T., Takeda K. & Akira S. Unresponsiveness of MyD88-deficient mice to endotoxin. Immunity. 11, 115–122 (1999). - PubMed
MeSH terms
Substances
LinkOut - more resources
Full Text Sources
Other Literature Sources
Research Materials
Miscellaneous
