

The evolution of intron size in amniotes: a role for powered flight?
- PMID: 22930760
- PMCID: PMC3490418
- DOI: 10.1093/gbe/evs070
The evolution of intron size in amniotes: a role for powered flight?
Abstract
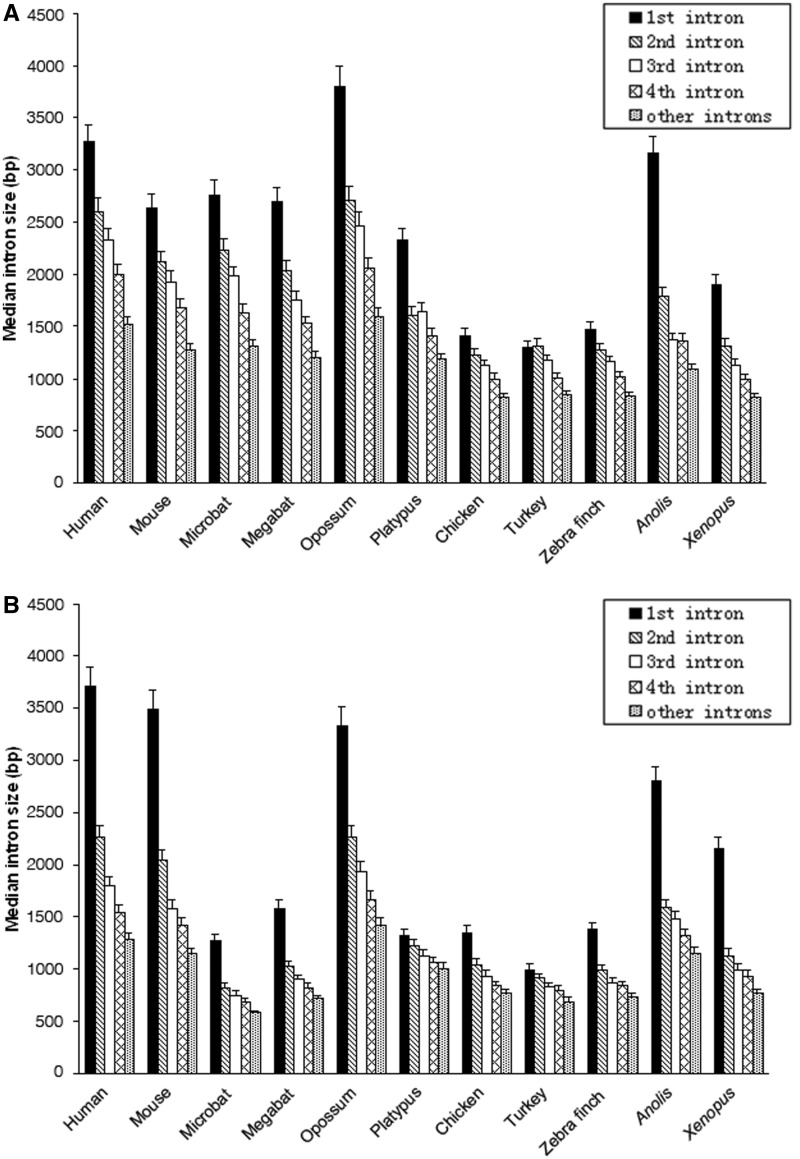
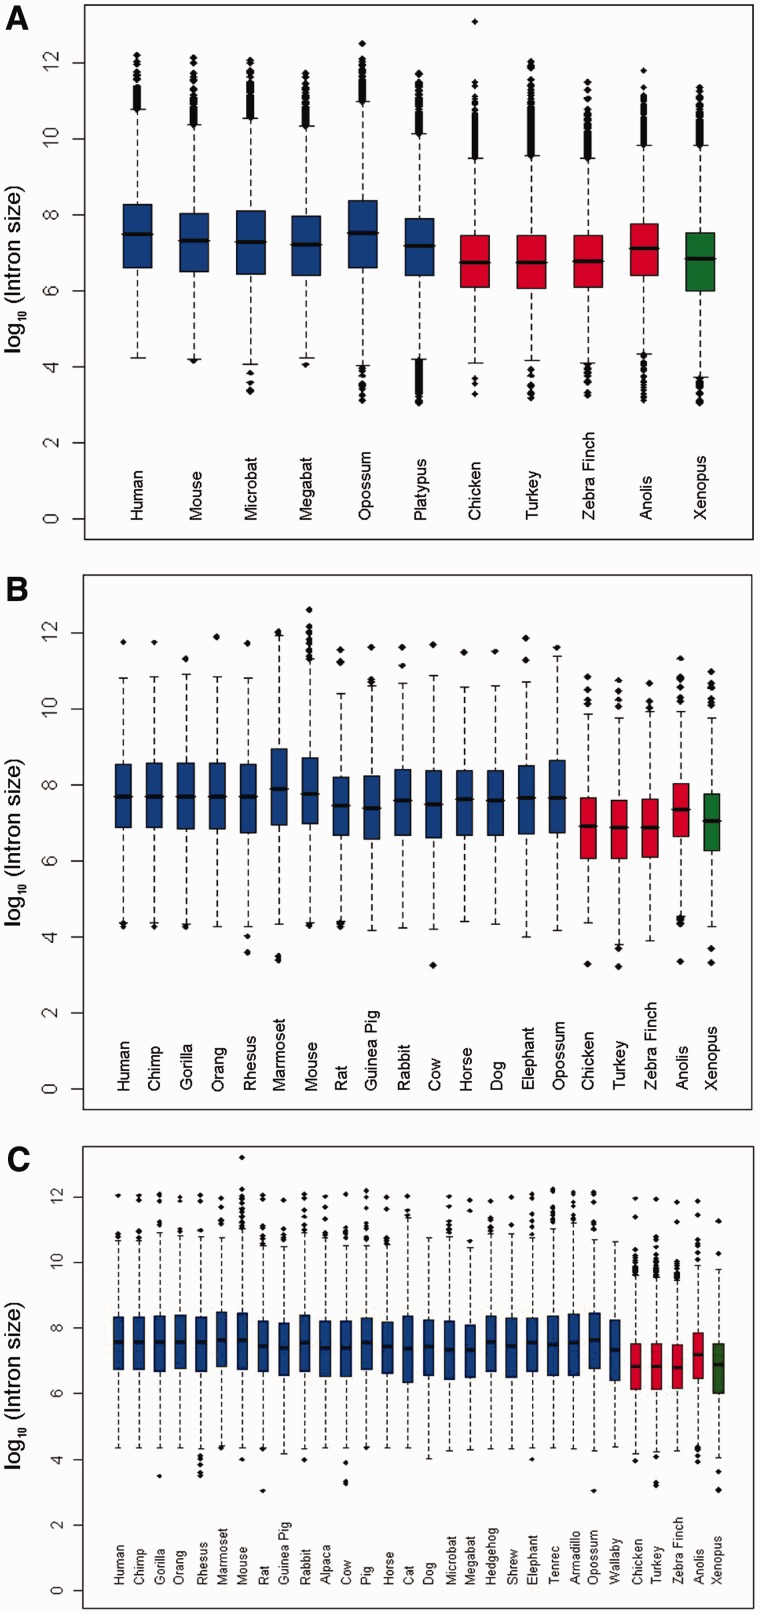
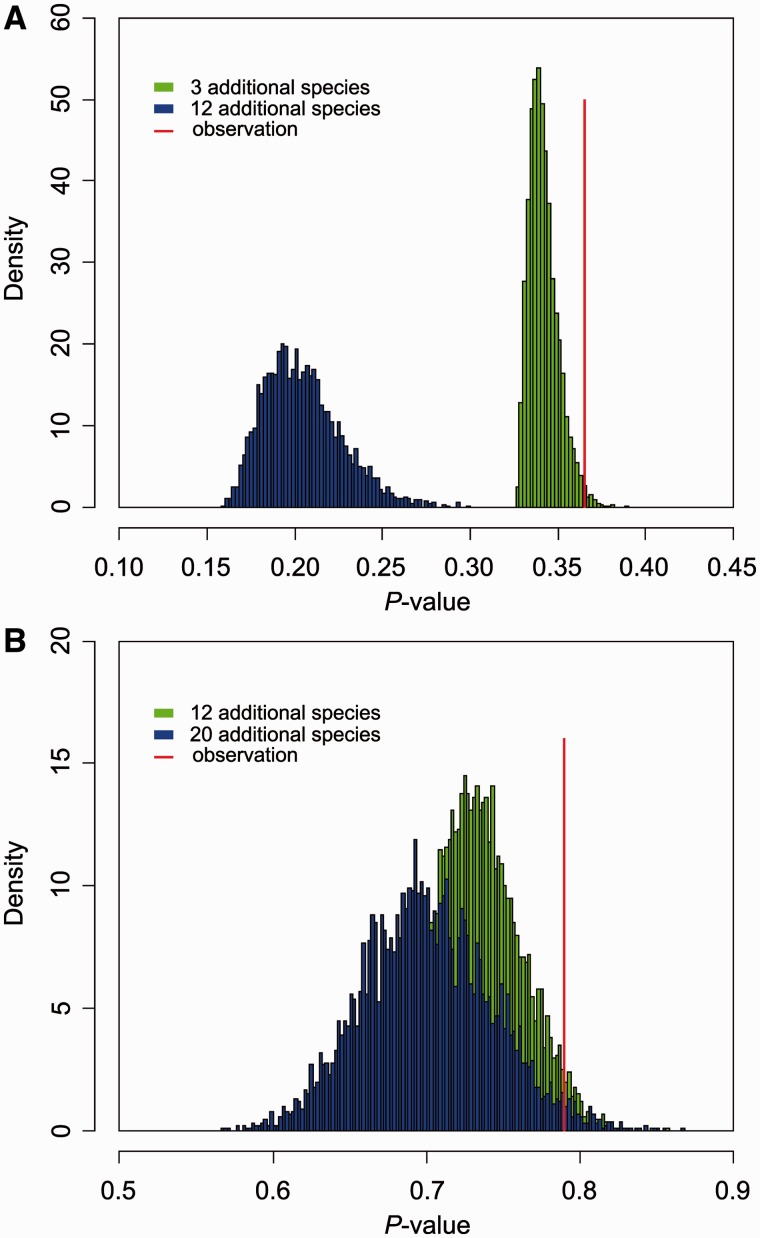
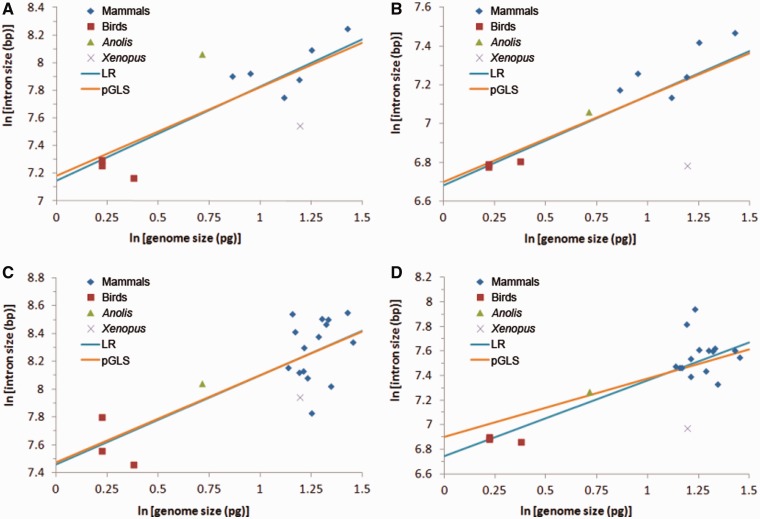
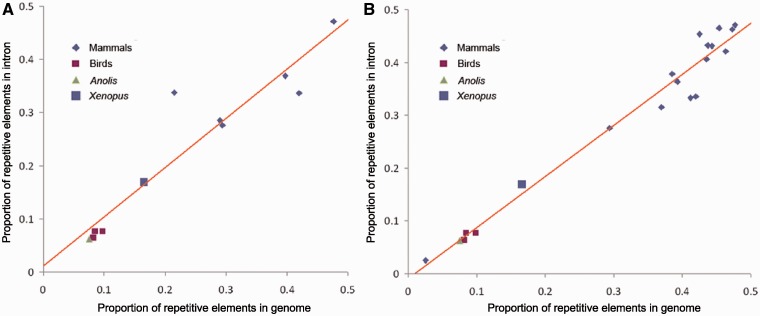
Intronic DNA is a major component of eukaryotic genes and genomes and can be subject to selective constraint and have functions in gene regulation. Intron size is of particular interest given that it is thought to be the target of a variety of evolutionary forces and has been suggested to be linked ultimately to various phenotypic traits, such as powered flight. Using whole-genome analyses and comparative approaches that account for phylogenetic nonindependence, we examined interspecific variation in intron size variation in three data sets encompassing from 12 to 30 amniotes genomes and allowing for different levels of genome coverage. In addition to confirming that intron size is negatively associated with intron position and correlates with genome size, we found that on average mammals have longer introns than birds and nonavian reptiles, a trend that is correlated with the proliferation of repetitive elements in mammals. Two independent comparisons between flying and nonflying sister groups both showed a reduction of intron size in volant species, supporting an association between powered flight, or possibly the high metabolic rates associated with flight, and reduced intron/genome size. Small intron size in volant lineages is less easily explained as a neutral consequence of large effective population size. In conclusion, we found that the evolution of intron size in amniotes appears to be non-neutral, is correlated with genome size, and is likely influenced by powered flight and associated high metabolic rates.
Figures
Comment in
-
Highlight--small genomes for the swift: of flight and intron size.Genome Biol Evol. 2012;4(10):1044-5. doi: 10.1093/gbe/evs076. Genome Biol Evol. 2012. PMID: 23114268 Free PMC article. No abstract available.
References
-
- Altschul SF, Gish W, Miller W, Myers EW, Lipman DJ. Basic local alignment search tool. J Mol Biol. 1990;215:403–410. - PubMed
-
- Bennett MD. Ordered disposition of parental genomes and individual chromosomes in reconstructed plant nuclei, and their implications. Somat Cell Mol Genet. 1987;13:463–466. - PubMed
-
- Benton M, Donoghue P, Asher R. Calibrating and constraining molecular clocks. In: Hedges S, Kumar S, editors. The timetree of life. New York: Oxford University Press; 2009. pp. 35–86.
Publication types
MeSH terms
LinkOut - more resources
Full Text Sources
