. 2012 Sep;140(3):307-24.
doi: 10.1085/jgp.201210826.

Tuning of EAG K(+) channel inactivation: molecular determinants of amplification by mutations and a small molecule

Affiliations

Tuning of EAG K(+) channel inactivation: molecular determinants of amplification by mutations and a small molecule

Vivek Garg et al. J Gen Physiol. 2012 Sep.

Abstract

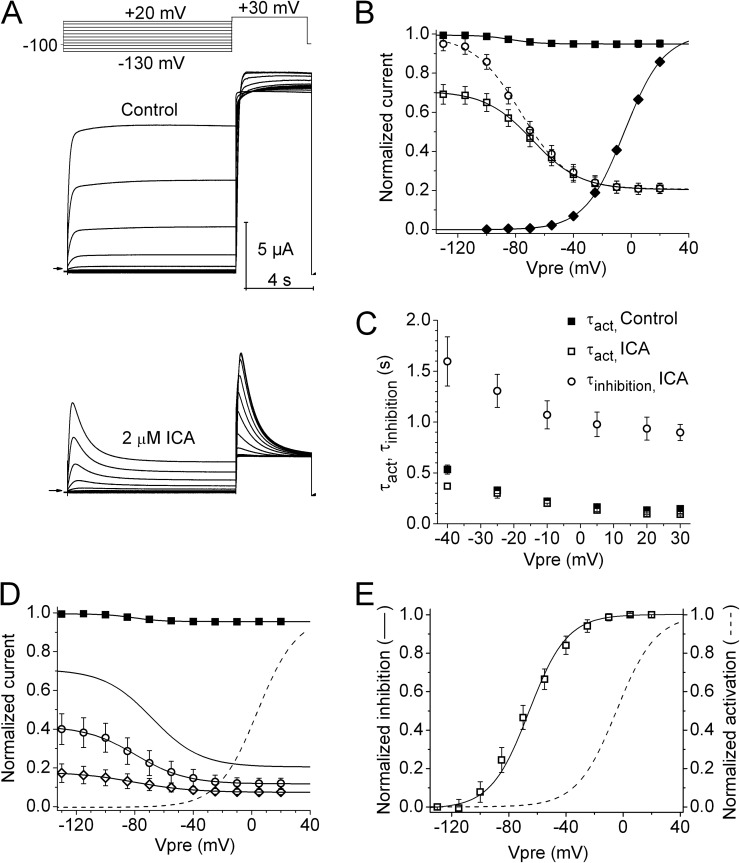
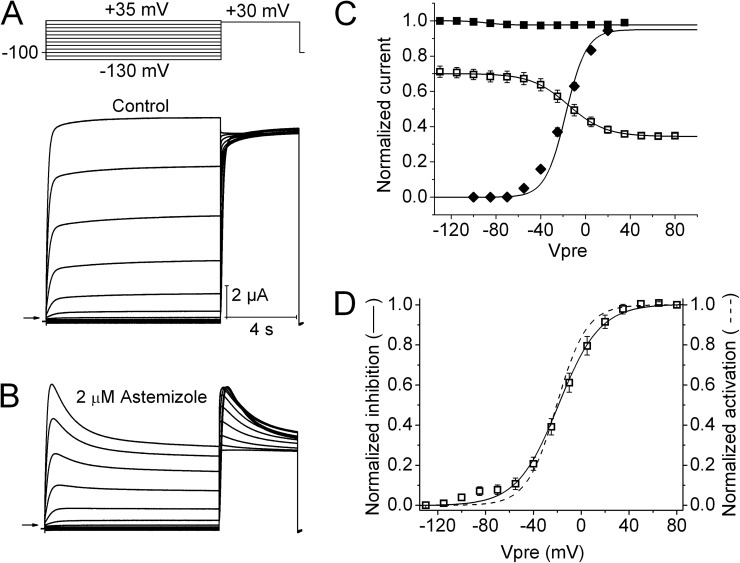
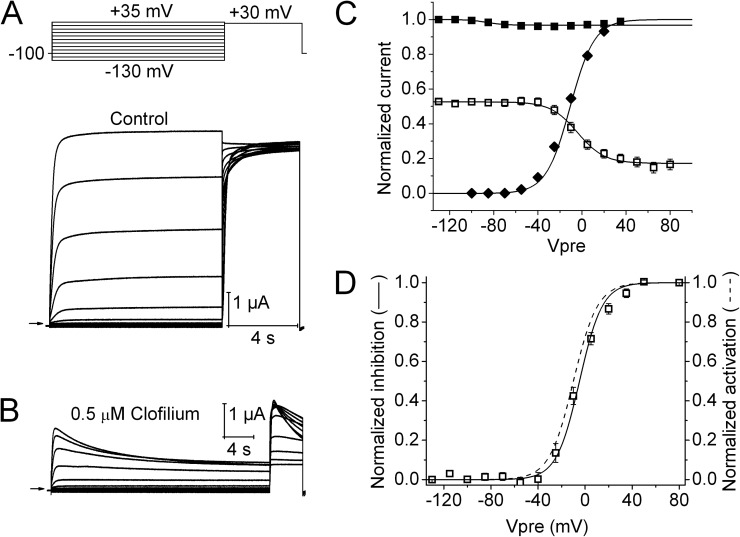
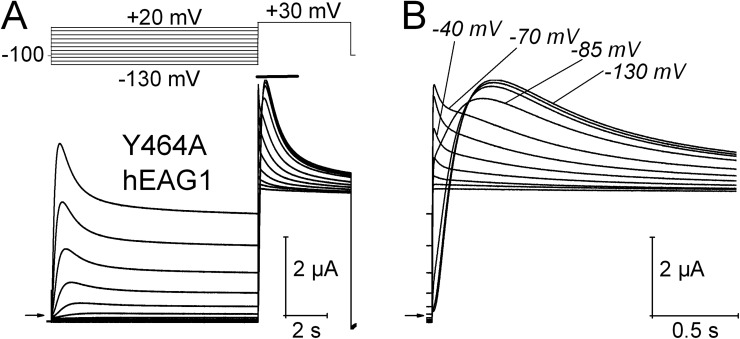
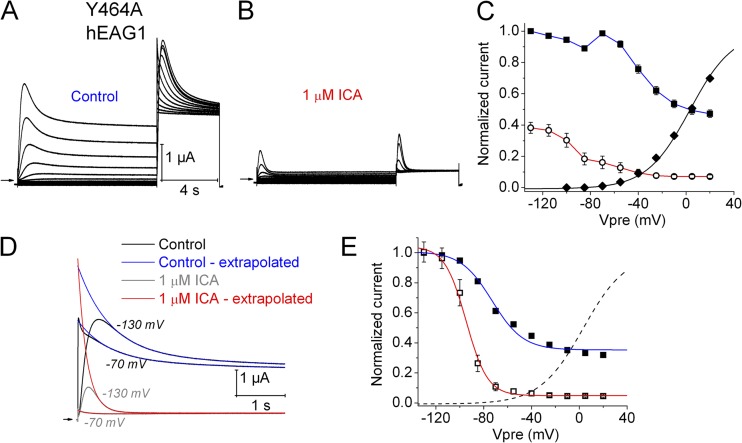
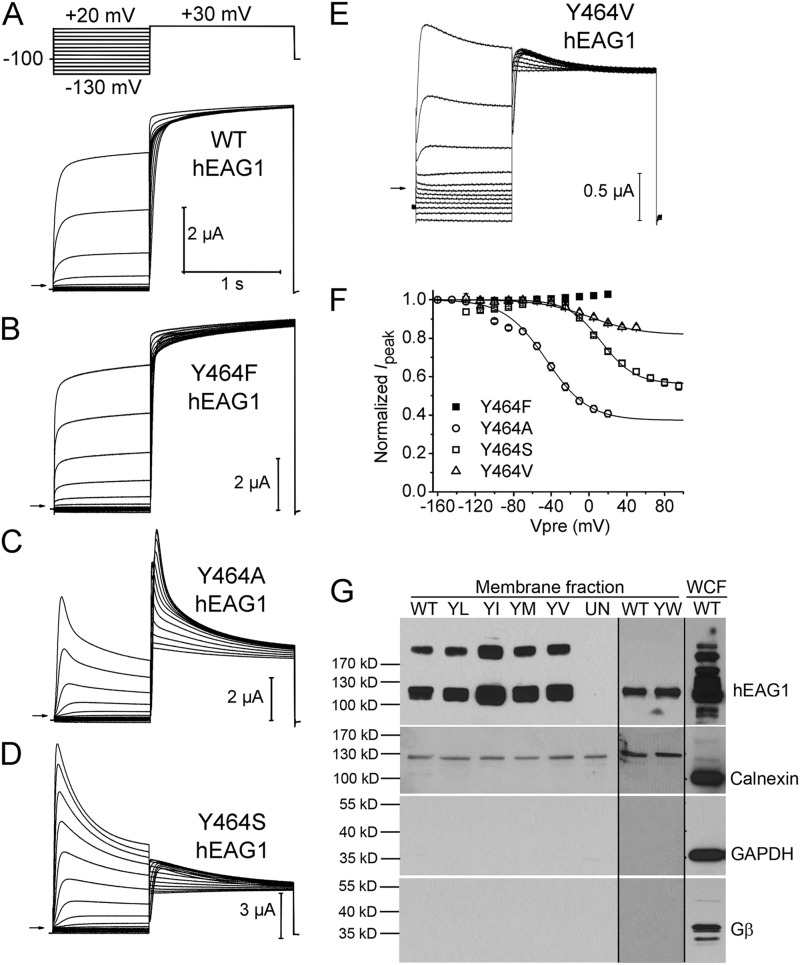
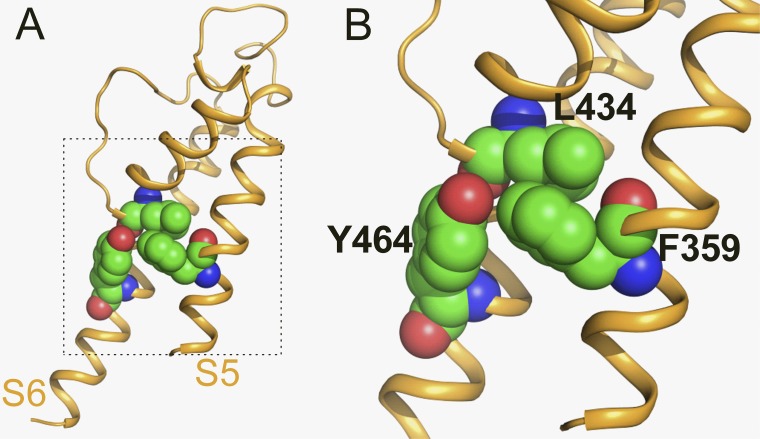
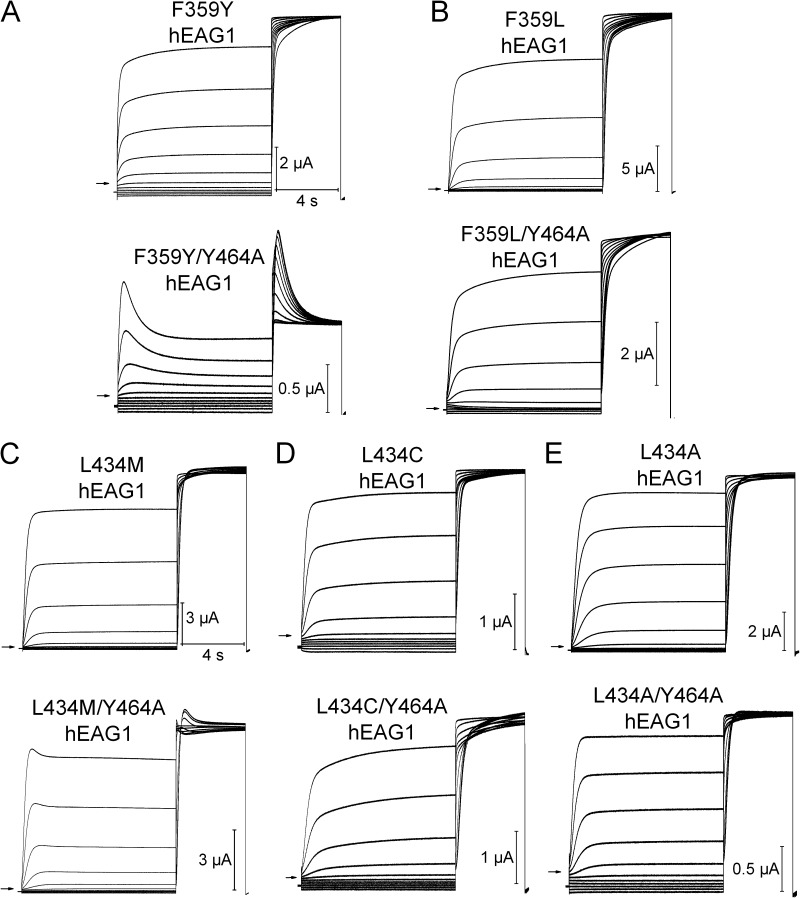
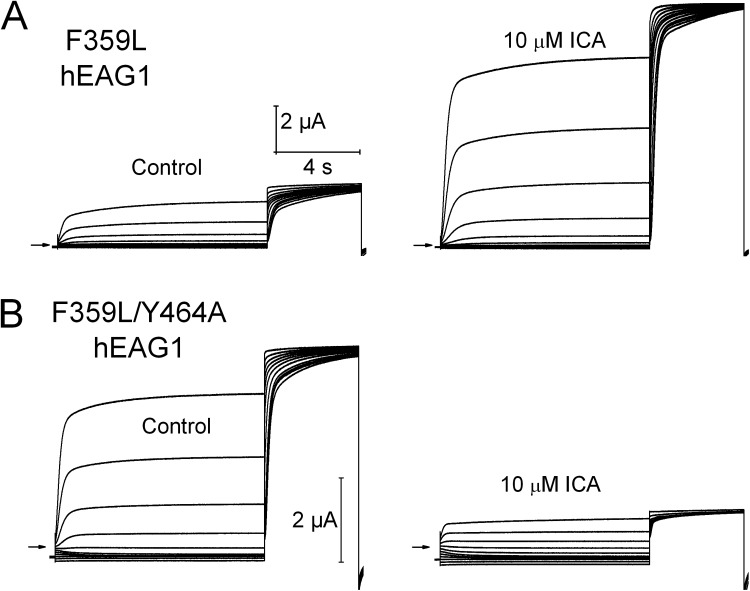
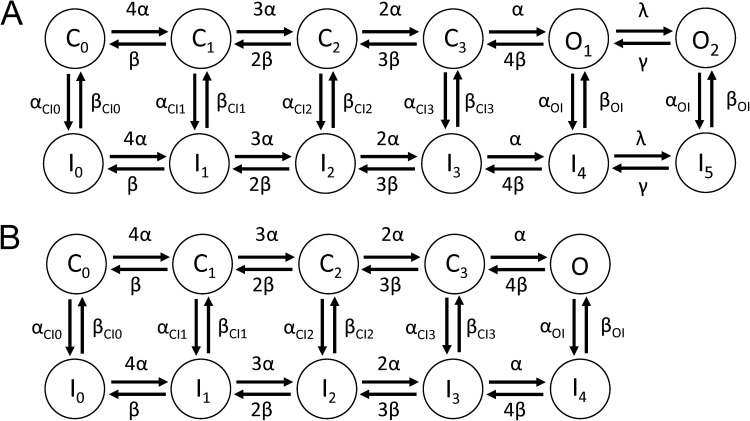
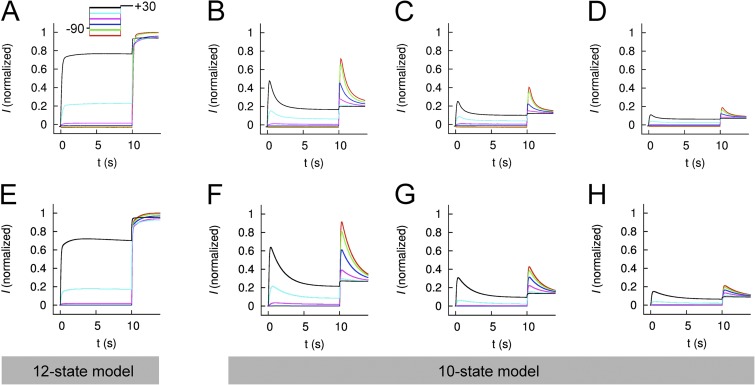
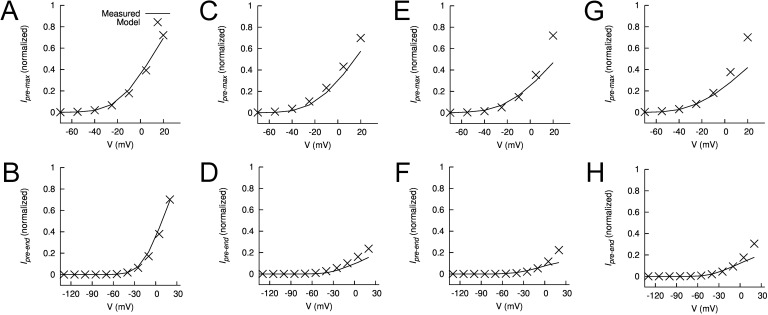
Ether-à-go-go (EAG) and EAG-related gene (ERG) K(+) channels are close homologues but differ markedly in their gating properties. ERG1 channels are characterized by rapid and extensive C-type inactivation, whereas mammalian EAG1 channels were previously considered noninactivating. Here, we show that human EAG1 channels exhibit an intrinsic voltage-dependent slow inactivation that is markedly enhanced in rate and extent by 1-10 µM 3-nitro-N-(4-phenoxyphenyl) benzamide, or ICA105574 (ICA). This compound was previously reported to have the opposite effect on ERG1 channels, causing an increase in current magnitude by inhibition of C-type inactivation. The voltage dependence of 2 µM ICA-induced inhibition of EAG1 current was half-maximal at -73 mV, 62 mV negative to the half-point for channel activation. This finding suggests that current inhibition by the drug is mediated by enhanced inactivation and not open-channel block, where the voltage half-points for current inhibition and channel activation are predicted to overlap, as we demonstrate for clofilium and astemizole. The mutation Y464A in the S6 segment also induced inactivation of EAG1, with a time course and voltage dependence similar to that caused by 2 µM ICA. Several Markov models were investigated to describe gating effects induced by multiple concentrations of the drug and the Y464A mutation. Models with the smallest fit error required both closed- and open-state inactivation. Unlike typical C-type inactivation, the rate of Y464A- and ICA-induced inactivation was not decreased by external tetraethylammonium or elevated [K(+)](e). EAG1 channel inactivation introduced by Y464A was prevented by additional mutation of a nearby residue located in the S5 segment (F359A) or pore helix (L434A), suggesting a tripartite molecular model where interactions between single residues in S5, S6, and the pore helix modulate inactivation of EAG1 channels.


Figures

Figure 1.
Figure 1.
Intrinsic inactivation of hEAG1 channels is enhanced by ICA. (A) hEAG1 currents recorded before (Control, middle) and after 2 µM ICA (bottom) using the voltage-pulse protocol shown in the top. Vh was −100 mV, and Vpre was 10 s in duration and ranged from −130 to +20 mV, applied in 15-mV increments. After each Vpre, a test pulse was applied to +30 mV. Zero current level is indicated by an arrow on the bottom left of the current traces in this panel and in all other figures. (B) Voltage dependence of hEAG1 activation (control, ◆) and inactivation in the absence (■) and presence of 2 µM ICA (□). For inactivation curves, normalized Imax was plotted as a function of Vpre. For the activation curve, Ipre normalized for electrical driving force was plotted as a function of Vpre. Data (n = 7) were fitted with a Boltzmann function (curves). For control inactivation, V0.5 = −81.4 ± 3.5 mV and z = 1.49 ± 0.32; for control activation, V0.5 = −4.6 ± 0.7 mV and z = 1.83 ± 0.06. For inactivation in the presence of ICA, V0.5 = −66.0 ± 4.1 mV and z = 1.15 ± 0.15. ○, extrapolated Imax in the presence of 2 µM ICA: V0.5 = −73.3 ± 3.9 mV and z = 1.11 ± 0.16. (C) Plot of time constants for onset of activation (control, ■; 2 µM ICA, □) and inactivation (2 µM ICA, ○) during the 10-s Vpres (n = 8). (D) Voltage dependence of inactivation in the absence and presence of three concentrations of ICA. The normalized ImaxVpre relationship for the test pulse is plotted for control (■), 2 µM ICA (solid curve; same as data plotted in B), 5 µM ICA (○), and 10 µM ICA (◇). For reference, the voltage dependence of hEAG1 activation (B) is replotted as a dashed curve. For control inactivation, V0.5 = −82.6 ± 2.6 mV and z = 1.26 ± 0.36 (n = 16). For 5 µM ICA, V0.5 = −80.0 ± 4.4 mV and z = 1.65 ± 0.27 (n = 5); for 10 µM ICA, V0.5 = −89.5 ± 4.7 mV and z = 1.39 ± 0.17 (n = 7). (E) Plot of the voltage dependence of hEAG1 control activation and inactivation after 2 µM ICA. For inactivation, minimum and maximum Imax was set to 0 and 1, respectively.
Figure 2.
Figure 2.
Voltage-dependent hEAG1 channel block by astemizole. (A) Control hEAG1 currents (bottom) elicited with voltage-pulse protocol shown in the top. Vh was −100 mV, and Vpre was 10 s in duration and ranged from −130 to +35 mV, applied in 15-mV increments. (B) Currents recorded from the same oocyte after steady-state block by 2 µM astemizole. (C) Voltage dependence of hEAG1 activation (◆) and inactivation (■) in control, and inhibition by 2 µM astemizole (□). For inactivation and inhibition curves, normalized Imax was plotted as a function of Vpre. For the activation curve, Ipre normalized for electrical driving force was plotted as a function of Vpre. Data (n = 5) were fitted with a Boltzmann function (curves). For control inactivation, V0.5 = −88.5 ± 2.4 mV and z = 2.84 ± 0.62; for control activation, V0.5 = −17.8 ± 1.4 mV and z = 1.84 ± 0.01. For inactivation in the presence of astemizole, V0.5 = −15.7 ± 3.3 mV and z = 1.51 ± 0.07. (D) Comparison of the voltage dependence of hEAG1 activation (dashed curve) and block by 2 µM astemizole (□).
Figure 3.
Figure 3.
Voltage dependence of hEAG1 channel block by clofilium. (A) Control hEAG1 currents (bottom) elicited with voltage-pulse protocol shown in the top. Vh was −100 mV, and Vpre was 10 s in duration and ranged from −130 to +35 mV, applied in 15-mV increments. (B) Currents recorded from same oocyte after steady-state block by 0.5 µM clofilium. Note that the duration of Vpre was increased to 30 s. (C) Voltage dependence of hEAG1 activation (◆) and inactivation (■) in control, and inhibition by 0.5 µM clofilium (□). For inactivation and inhibition curves, normalized Imax was plotted as a function of Vpre. For the activation curve, Ipre normalized for electrical driving force was plotted as a function of Vpre. Data (n = 5) were fitted with a Boltzmann function (curves). For control inactivation, V0.5 = −86.7 ± 4.5 mV and z = 3.12 ± 1.21; for control activation, V0.5 = −12.4 ± 0.8 mV and z = 2.00 ± 0.02. For inactivation in the presence of clofilium, V0.5 = −5.2 ± 1.7 mV and z = 2.13 ± 0.13. (D) Comparison of the voltage dependence of hEAG1 activation (dashed curve) and block by 0.5 µM clofilium (□).
Figure 4.
Figure 4.
Y464A hEAG1 channels exhibit enhanced inactivation. (A) Voltage-pulse protocol and corresponding Y464A hEAG1 currents. (B) Test-pulse currents (during time indicated by a solid bar in A) are shown on an expanded time scale. Test currents elicited after Vpre of −130, −85, −70, and −40 mV are labeled. A fast inactivating component of current is evident when Vpre ≥ −70 mV.
Figure 5.
Figure 5.
Effect of 1 µM ICA on Y464A hEAG1 channel currents. (A) Control Y464A hEAG1 currents elicited with two-pulse protocol, where Vh was −100 mV and Vpre was 10 s in duration and ranged from −130 to +20 mV applied in 15-mV increments, each followed by a test pulse to +30 mV. (B) Currents recorded after steady-state inhibition of hEAG1 by 1 µM ICA. (C) Voltage dependence of activation (◆) and inactivation in the absence (■) and presence (○) of 1 µM ICA. For control activation, V0.5 = −15.1 ± 2.1 mV and z = 1.31 ± 0.02 (n = 8). (D) Test-pulse currents recorded at +30 mV after Vpre to −130 and −70 mV during control and after 1 µM ICA. Traces were fitted with two-exponential function and extrapolated back to the start of the pulse for control (blue curves) and after 1 µM ICA (red curves). (E) Extrapolated ImaxVpre relationships for control (■) and after 1 µM ICA (□). Dashed curve is same activation curve plotted in C. For control inactivation, V0.5 = −73.3 ± 0.7 mV and z = 1.44 ± 0.05 (n = 8). For 1 µM ICA, V0.5 = −94.3 ± 1.9 mV and z = 3.78 ± 0.16 (n = 8).
Figure 6.
Figure 6.
Mutation of Tyr464 in hEAG1 has variable effects on inactivation. (A–E) WT or indicated mutant hEAG1 currents recorded from oocytes bathed in Mg2+-free external solution. WT currents were elicited with voltage-pulse protocol shown in the top: Vh was −100 mV and Vpre was 1 s in duration and ranged from −130 to +20 mV, applied in 15-mV increments. After each Vpre, a 1.5-s test pulse was applied to +30 mV to measure channel availability. For some mutant channels Vh and/or Vpre was varied as follows: Y464A, Vh = −130 mV and Vpre ranged from −160 to +20 mV; Y464S, Vpre ranged from −130 to +95 mV; Y464V, Vpre ranged from −130 to +50 mV. (F) Voltage dependence of inactivation for mutant hEAG1 channels (n = 4–6) as indicated. Boltzmann fits: Y464A, V0.5 = −45.0 ± 1.3 mV and z = 1.14 ± 0.07; Y464S, V0.5 = 13.0 ± 1.8 mV and z = 1.43 ± 0.12; Y464V, V0.5 = 1.6 ± 12.4 mV and z = 0.96 ± 0.13. (G; top) Western blots for hEAG1 in the NeutrAvidin-captured cell surface protein fractions (membrane fraction) from a single batch of oocytes expressing WT or Tyr464 mutant channels. YL, Y464L; YI, Y464I; YM, Y464M; YV, Y464V). The hEAG1 monomer is represented by the 113-kD band; a higher band was also seen in all injected oocytes, but not in the uninjected oocytes (UN). Y464W (YW) channels and matched control (WT) channels were studied with a different batch of oocytes (less hEAG1 protein; therefore, dimer band was absent) on a different gel. For all hEAG1 constructs, each oocyte was injected with 20 ng cRNA. hEAG1 antibody showed reactivity to multiple intracellular proteins in the whole cell fraction (WCF), overlapping the 113-kD hEAG1 protein signal. Rightmost lane is for the WCF. (Bottom three panels) Western blots for calnexin, GAPDH, and Gβ from the same preparations as the top panel. Notice the absence of these three proteins in the membrane fraction.
Figure 7.
Figure 7.
Homology model of the pore domain for a single hEAG1 subunit. Model used the crystal structure of KcsA (Protein Data Bank accession no. 1BL8) as a template. Lateral view (A) and close-up view (B) of a subunit with Leu434 (base of pore helix), Tyr464 (S6), and Phe359 (S5) residues shown in space fill.
Figure 8.
Figure 8.
Intragenic rescue of Y464A-enhanced hEAG1 inactivation by a second site mutation in either Phe359 (in S5) or Leu434 (in pore helix). (A–E) Currents for indicated mutant hEAG1 channels recorded during two-pulse inactivation protocol: Vh = −100 mV, and Vpre (10 s) ranged from −130 to +20 mV, applied in 15-mV increments. A test pulse to +30 mV was applied after each Vpre. The top set of traces in each panel is for channels with indicated single mutation; the bottom set of traces shows currents for same mutation introduced into the Y464A channel. All mutations except the conserved F359Y (A, bottom) and L434M (C, bottom) rescued inactivation of Y464A. Inward currents in some traces represent unsubtracted leak currents. Based on reversal potential of time-dependent currents, only F359L/Y464A channels had reduced K+ selectivity. Currents shown are representative of four to six oocytes for each mutant channel.
Figure 9.
Figure 9.
ICA activates F359L hEAG1 channels and inhibits F359L/Y464A hEAG1 channels. (A) F359L hEAG1 currents recorded under control conditions and after the application of 10 µM ICA. (B) F359L/Y464A hEAG1 currents recorded under control conditions and after the application of 10 µM ICA. In all panels, currents were elicited with two-pulse inactivation protocol: Vh = −100 mV, and Vpre (10 s) ranged from −130 to +20 mV, applied in 15-mV increments. A test pulse to +30 mV was applied after each Vpre.
Figure 10.
Figure 10.
Schematics of (A) 12- and (B) 10-state Markov models of EAG1 channel current.
Figure 11.
Figure 11.
Comparison of measured and modeled currents for WT hEAG1. (A–D) Currents recorded from five to eight oocytes for each condition (Control [A] or ICA at 2 [B], 5 [C], and 10 µM [D]) were averaged and normalized to their corresponding peak control current. Voltage-pulse protocol: Vh = −90 mV and Vpre (10 s) ranged from −130 to +20 mV, applied in 30-mV increments; at 10 s, a test pulse to +30 mV was applied. (E–H) Simulated EAG currents (I) for control (E, 12-state model) and in the presence of 2 (F), 5 (G), and 10 µM (H) ICA (all 10-state models).
Figure 12.
Figure 12.
Features of measured and modeled WT hEAG1 current during prepulses. (A–H) Plots of normalized maximum (Ipremax) and end (Ipreend) currents during the prepulse for control (A and B) in the presence of 2 (C and D), 5 (E and F), and 10 µM ICA (G and H). In each panel, experimentally measured currents (curves) are compared with modeled currents (X), all normalized to their respective Imax (peak current at Vt of +30 mV).
Figure 13.
Figure 13.
Features of measured and modeled WT hEAG1 current during test pulses to +30 mV. (A–H) Plots of normalized maximum (Imax) and end (Iend) currents during test pulse for control (A and B) in the presence of 2 (C and D), 5 (E and F), and 10 µM ICA (G and H). In each panel, experimentally measured currents (curves) are compared with modeled currents (X), all normalized to their respective Imax.
Figure 14.
Figure 14.
Comparison of measured and modeled currents of Y464A hEAG1. (A) Currents recorded from 10 oocytes were averaged and normalized to Imax. Voltage-pulse protocol: Vh = −90 mV and Vpre (10 s) ranged from −130 to +20 mV, applied in 30-mV increments; at 10 s, a test pulse to +30 mV was applied. (B) Simulated EAG1 currents (I) for Y464A hEAG1. Features of the currents were extracted during the prepulse (C and D) and test pulse (E and F). In each panel, experimentally measured currents (curves) are compared with model currents (X), all normalized to their respective Imax.

References

    1. Abbruzzese J., Sachse F.B., Tristani-Firouzi M., Sanguinetti M.C. 2010. Modification of hERG1 channel gating by Cd2+. J. Gen. Physiol. 136:203–224 10.1085/jgp.201010450 - DOI - PMC - PubMed
    1. Arnold K., Bordoli L., Kopp J., Schwede T. 2006. The SWISS-MODEL workspace: a web-based environment for protein structure homology modelling. Bioinformatics. 22:195–201 10.1093/bioinformatics/bti770 - DOI - PubMed
    1. Brüggemann A., Pardo L.A., Stühmer W., Pongs O. 1993. Ether-à-go-go encodes a voltage-gated channel permeable to K+ and Ca2+ and modulated by cAMP. Nature. 365:445–448 10.1038/365445a0 - DOI - PubMed
    1. Chao C.C., Shieh J., Kuo S.C., Wu B.T., Hour M.J., Leung Y.M. 2008. HMJ-53A accelerates slow inactivation gating of voltage-gated K+ channels in mouse neuroblastoma N2A cells. Neuropharmacology. 54:1128–1135 10.1016/j.neuropharm.2008.03.006 - DOI - PubMed
    1. Chen J., Avdonin V., Ciorba M.A., Heinemann S.H., Hoshi T. 2000. Acceleration of P/C-type inactivation in voltage-gated K+ channels by methionine oxidation. Biophys. J. 78:174–187 10.1016/S0006-3495(00)76583-0 - DOI - PMC - PubMed

Publication types

MeSH terms