Selected approaches for rational drug design and high throughput screening to identify anti-cancer molecules
- PMID: 22931411
- PMCID: PMC3763986
- DOI: 10.2174/187152012803529709
Selected approaches for rational drug design and high throughput screening to identify anti-cancer molecules
Abstract
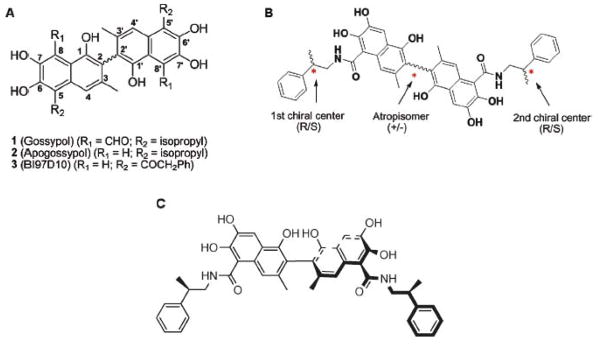
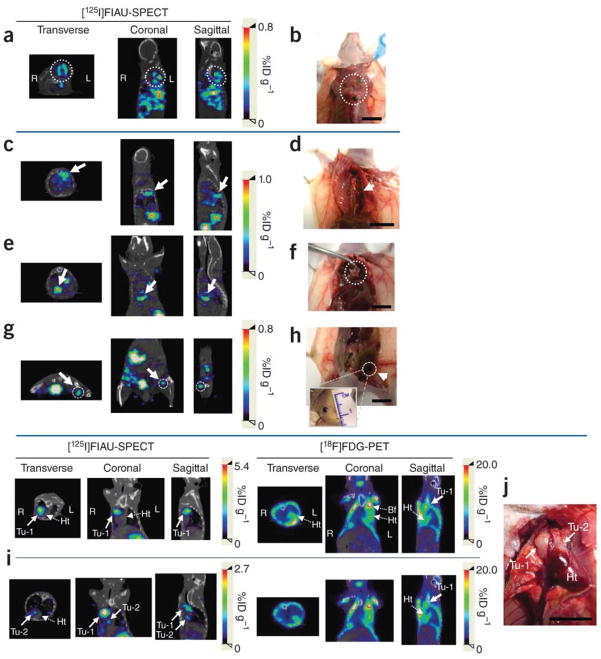
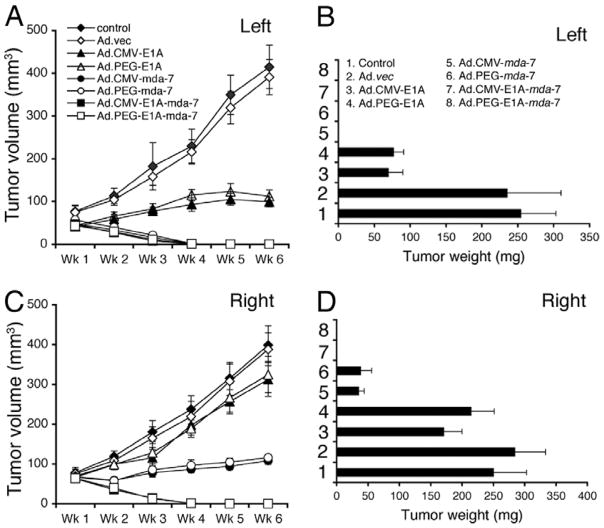
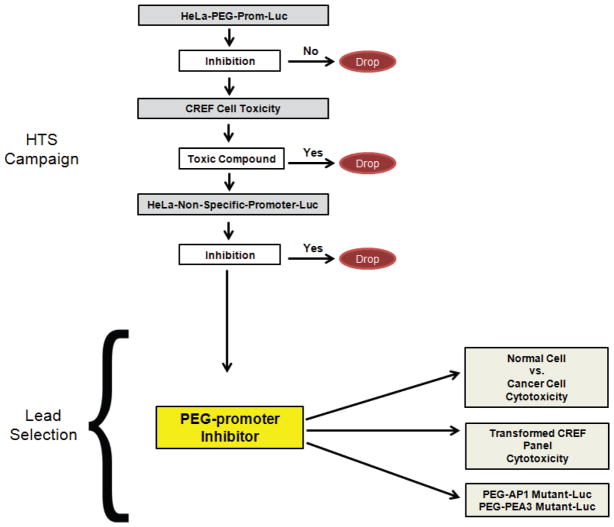
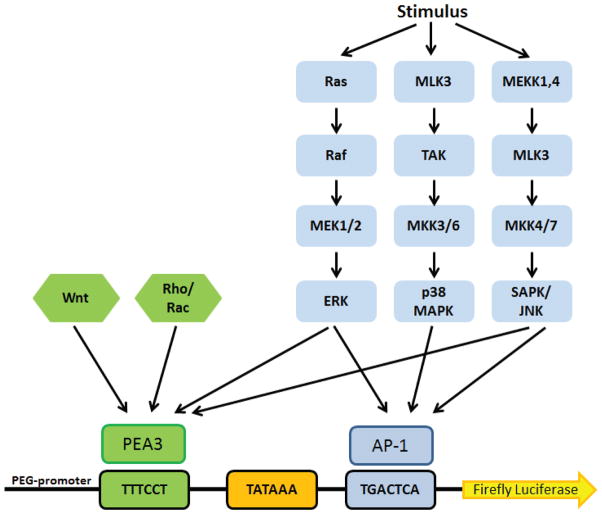
Structure-based modeling combined with rational drug design, and high throughput screening approaches offer significant potential for identifying and developing lead compounds with therapeutic potential. The present review focuses on these two approaches using explicit examples based on specific derivatives of Gossypol generated through rational design and applications of a cancer-specificpromoter derived from Progression Elevated Gene-3. The Gossypol derivative Sabutoclax (BI-97C1) displays potent anti-tumor activity against a diverse spectrum of human tumors. The model of the docked structure of Gossypol bound to Bcl-XL provided a virtual structure-activity-relationship where appropriate modifications were predicted on a rational basis. These structure-based studies led to the isolation of Sabutoclax, an optically pure isomer of Apogossypol displaying superior efficacy and reduced toxicity. These studies illustrate the power of combining structure-based modeling with rational design to predict appropriate derivatives of lead compounds to be empirically tested and evaluated for bioactivity. Another approach to cancer drug discovery utilizes a cancer-specific promoter as readouts of the transformed state. The promoter region of Progression Elevated Gene-3 is such a promoter with cancer-specific activity. The specificity of this promoter has been exploited as a means of constructing cancer terminator viruses that selectively kill cancer cells and as a systemic imaging modality that specifically visualizes in vivo cancer growth with no background from normal tissues. Screening of small molecule inhibitors that suppress the Progression Elevated Gene-3-promoter may provide relevant lead compounds for cancer therapy that can be combined with further structure-based approaches leading to the development of novel compounds for cancer therapy.
Figures
Similar articles
-
BI-97C1, an optically pure Apogossypol derivative as pan-active inhibitor of antiapoptotic B-cell lymphoma/leukemia-2 (Bcl-2) family proteins.J Med Chem. 2010 May 27;53(10):4166-76. doi: 10.1021/jm1001265. J Med Chem. 2010. PMID: 20443627 Free PMC article.
-
Apogossypol derivative BI-97C1 (Sabutoclax) targeting Mcl-1 sensitizes prostate cancer cells to mda-7/IL-24-mediated toxicity.Proc Natl Acad Sci U S A. 2011 May 24;108(21):8785-90. doi: 10.1073/pnas.1100769108. Epub 2011 May 9. Proc Natl Acad Sci U S A. 2011. PMID: 21555592 Free PMC article.
-
Therapy of prostate cancer using a novel cancer terminator virus and a small molecule BH-3 mimetic.Oncotarget. 2015 May 10;6(13):10712-27. doi: 10.18632/oncotarget.3544. Oncotarget. 2015. PMID: 25926554 Free PMC article.
-
Natural Product Gossypol and its Derivatives in Precision Cancer Medicine.Curr Med Chem. 2019;26(10):1849-1873. doi: 10.2174/0929867324666170523123655. Curr Med Chem. 2019. PMID: 28545375 Review.
-
BH3 mimetics: status of the field and new developments.Mol Cancer Ther. 2013 Sep;12(9):1691-700. doi: 10.1158/1535-7163.MCT-13-0058. Epub 2013 Aug 23. Mol Cancer Ther. 2013. PMID: 23974697 Review.
Cited by
-
Novel Sulforaphane Analog Disrupts Phosphatidylinositol-3-Kinase-Protein Kinase B Pathway and Inhibits Cancer Cell Progression via Reactive Oxygen Species-Mediated Caspase-Independent Apoptosis.ACS Pharmacol Transl Sci. 2023 Dec 12;7(1):195-211. doi: 10.1021/acsptsci.3c00229. eCollection 2024 Jan 12. ACS Pharmacol Transl Sci. 2023. PMID: 38230291 Free PMC article.
-
Quantum mechanics implementation in drug-design workflows: does it really help?Drug Des Devel Ther. 2017 Aug 31;11:2551-2564. doi: 10.2147/DDDT.S126344. eCollection 2017. Drug Des Devel Ther. 2017. PMID: 28919707 Free PMC article. Review.
-
A PDZ Protein MDA-9/Syntenin: As a Target for Cancer Therapy.Comput Struct Biotechnol J. 2019 Jan 8;17:136-141. doi: 10.1016/j.csbj.2019.01.002. eCollection 2019. Comput Struct Biotechnol J. 2019. PMID: 30766662 Free PMC article. Review.
-
Suppression of Her2/Neu mammary tumor development in mda-7/IL-24 transgenic mice.Oncotarget. 2015 Nov 10;6(35):36943-54. doi: 10.18632/oncotarget.6046. Oncotarget. 2015. PMID: 26460950 Free PMC article.
-
Musashi-1-A Stemness RBP for Cancer Therapy?Biology (Basel). 2021 May 5;10(5):407. doi: 10.3390/biology10050407. Biology (Basel). 2021. PMID: 34062997 Free PMC article. Review.
References
-
- Hanahan D, Weinberg RA. Hallmarks of cancer: the next generation. Cell. 2011;144(5):646–674. - PubMed
-
- Dash R, Azab B, Shen XN, Sokhi UK, Sarkar S, Su ZZ, Wang XY, Claudio PP, Dent P, Dmitriev IP, Curiel DT, Grant S, Sarkar D, Fisher PB. Developing an effective gene therapy for prostate cancer: New technologies with potential to translate from the laboratory into the clinic. Discovery Med. 2011;11(56):46–56. - PMC - PubMed
-
- Das SK, Bhutia SK, Kegelman TP, Peachy L, Oyesanya RA, Dasgupta S, Sokhi UK, Azab B, Dash R, Quinn BA, Kim K, Barral PM, Su ZZ, Boukerche H, Sarkar D, Fisher PB. MDA-9/syntenin: a positive gatekeeper of melanoma metastasis. Front Biosci. 2012;17:1–15. - PubMed
-
- Reed JC. Dysregulation of apoptosis in cancer. J Clin Oncol. 1999;17(9):2941–53. - PubMed
-
- Johnstone RW, Ruefli AA, Lowe SW. Apoptosis: a link between cancer genetics and chemotherapy. Cell. 2002;108(2):153–64. - PubMed
Publication types
MeSH terms
Substances
Grants and funding
LinkOut - more resources
Full Text Sources
Other Literature Sources
Research Materials