

Incorporation of eicosapentaenoic and docosahexaenoic acids into lipid pools when given as supplements providing doses equivalent to typical intakes of oily fish
- PMID: 22932281
- PMCID: PMC3441107
- DOI: 10.3945/ajcn.112.041343
Incorporation of eicosapentaenoic and docosahexaenoic acids into lipid pools when given as supplements providing doses equivalent to typical intakes of oily fish
Abstract
Background: Estimation of the intake of oily fish at a population level is difficult. The measurement of eicosapentaenoic acid (EPA) and docosahexaenoic acid (DHA) in biological samples may provide a useful biomarker of intake.
Objective: We identified the most appropriate biomarkers for the assessment of habitual oily fish intake and changes in intake by elucidating the dose- and time-dependent response of EPA and DHA incorporation into various biological samples that represent roles in fatty acid transport, function, and storage.
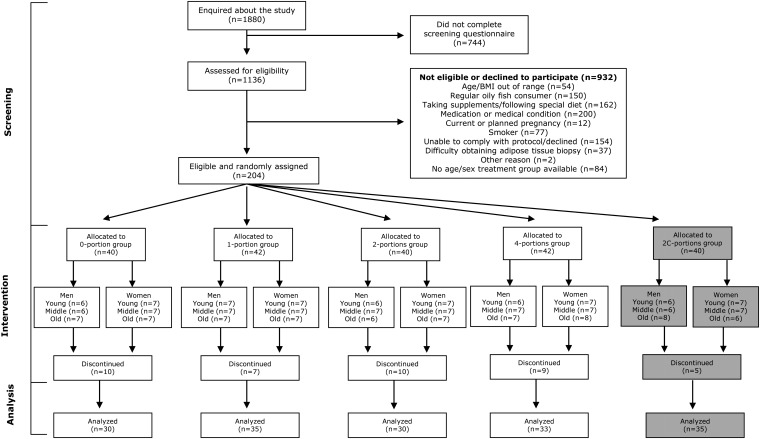
Design: This was a double-blind, randomized, controlled intervention trial in 204 men and women that lasted 12 mo. EPA and DHA capsules were provided in a manner to reflect sporadic consumption of oily fish (ie, 1, 2, or 4 times/wk). EPA and DHA were assessed at 9 time points over 12 mo in 9 sample types (red blood cells, mononuclear cells, platelets, buccal cells, adipose tissue, plasma phosphatidylcholine, triglycerides, cholesteryl esters, and nonesterified fatty acids).
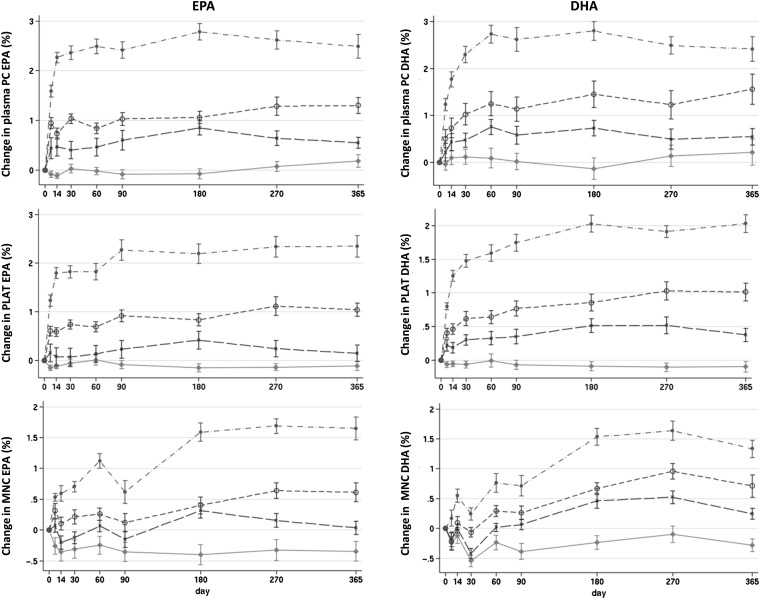
Results: A dose response (P < 0.05) was observed for EPA and DHA in all pools except for red blood cell EPA (P = 0.057). EPA and DHA measures in plasma phosphatidylcholine and platelets were best for the discrimination between different intakes (P < 0.0001). The rate of incorporation varied between sample types, with the time to maximal incorporation ranging from days (plasma phosphatidylcholine) to months (mononuclear cells) to >12 mo (adipose tissue).
Conclusions: Plasma phosphatidylcholine EPA plus DHA was identified as the most suitable biomarker of acute changes in EPA and DHA intake, and platelet and mononuclear cell EPA plus DHA were the most suitable biomarkers of habitual intake.
Figures

References
-
- Wall R, Ross RP, Fitzgerald GF, Stanton C. Fatty acids from fish: the anti-inflammatory potential of long-chain omega-3 fatty acids. Nutr Rev 2010;68:280–9 - PubMed
-
- Kromhout D, Bosschieter EB, de Lezenne Coulander C. The inverse relation between fish consumption and 20-year mortality from coronary heart disease. N Engl J Med 1985;312:1205–9 - PubMed
-
- Fernandez E, Chatenoud L, La Vecchia C, Negri E, Franceschi S. Fish consumption and cancer risk. Am J Clin Nutr 1999;70:85–90 - PubMed
-
- Saravanan P, Davidson NC, Schmidt EB, Calder PC. Cardiovascular effects of marine omega-3 fatty acids. Lancet 2010;376:540–50 - PubMed
Publication types
MeSH terms
Substances
Associated data
Grants and funding
LinkOut - more resources
Full Text Sources
Other Literature Sources
Medical
Research Materials
