. 2012 Nov 1;18(21):5865-5877.
doi: 10.1158/1078-0432.CCR-12-1807. Epub 2012 Aug 29.

Novel tumor subgroups of urothelial carcinoma of the bladder defined by integrated genomic analysis

Affiliations

Novel tumor subgroups of urothelial carcinoma of the bladder defined by integrated genomic analysis

Carolyn D Hurst et al. Clin Cancer Res. .

Abstract

Purpose: There is a need for improved subclassification of urothelial carcinoma (UC) at diagnosis. A major aim of this study was to search for novel genomic subgroups.

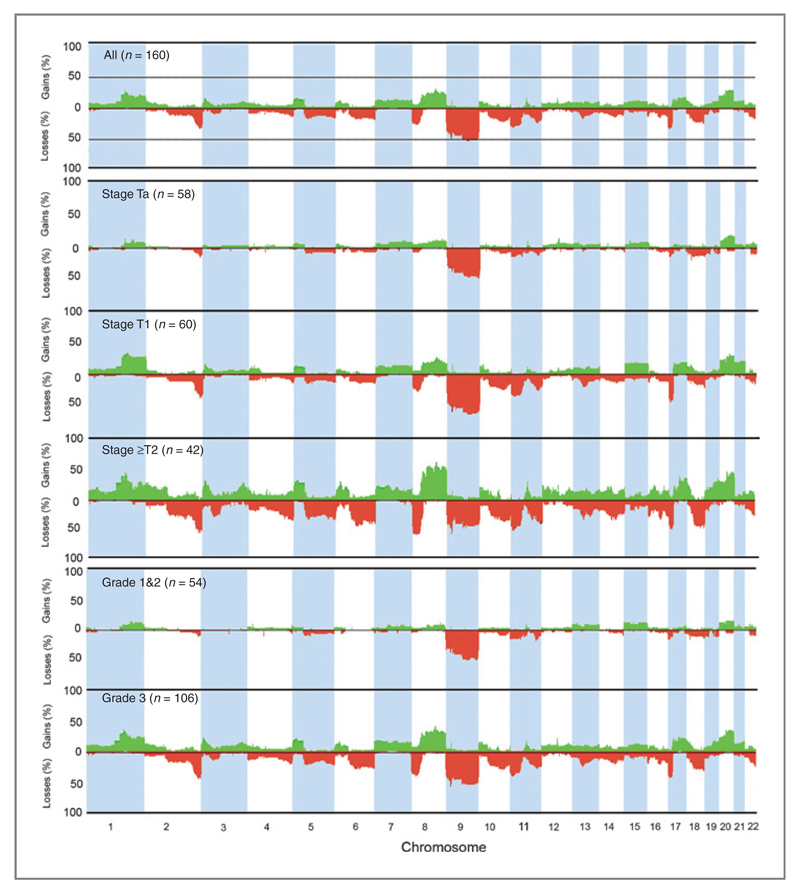
Experimental design: We assessed 160 tumors for genome-wide copy number alterations and mutation in genes implicated in UC. These comprised all tumor grades and stages and included 49 high-grade stage T1 (T1G3) tumors.

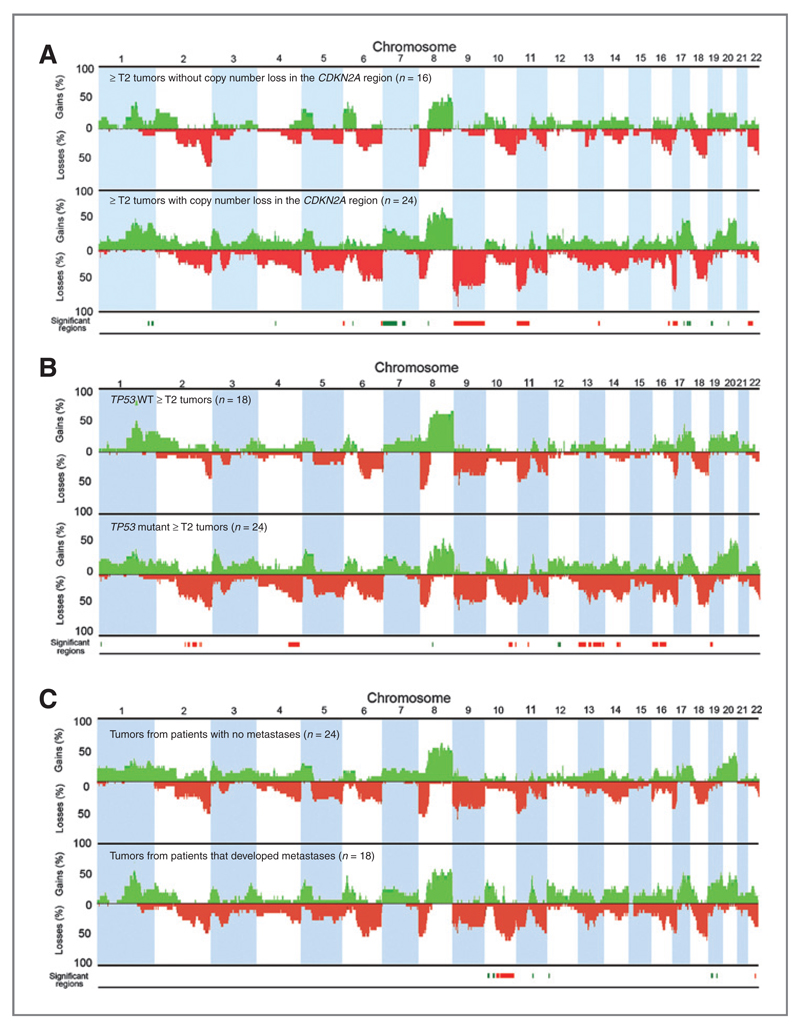
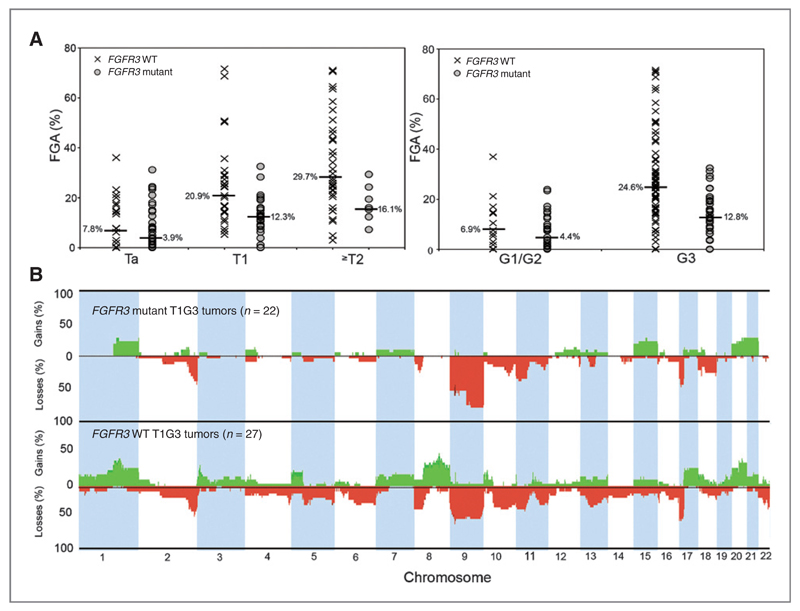
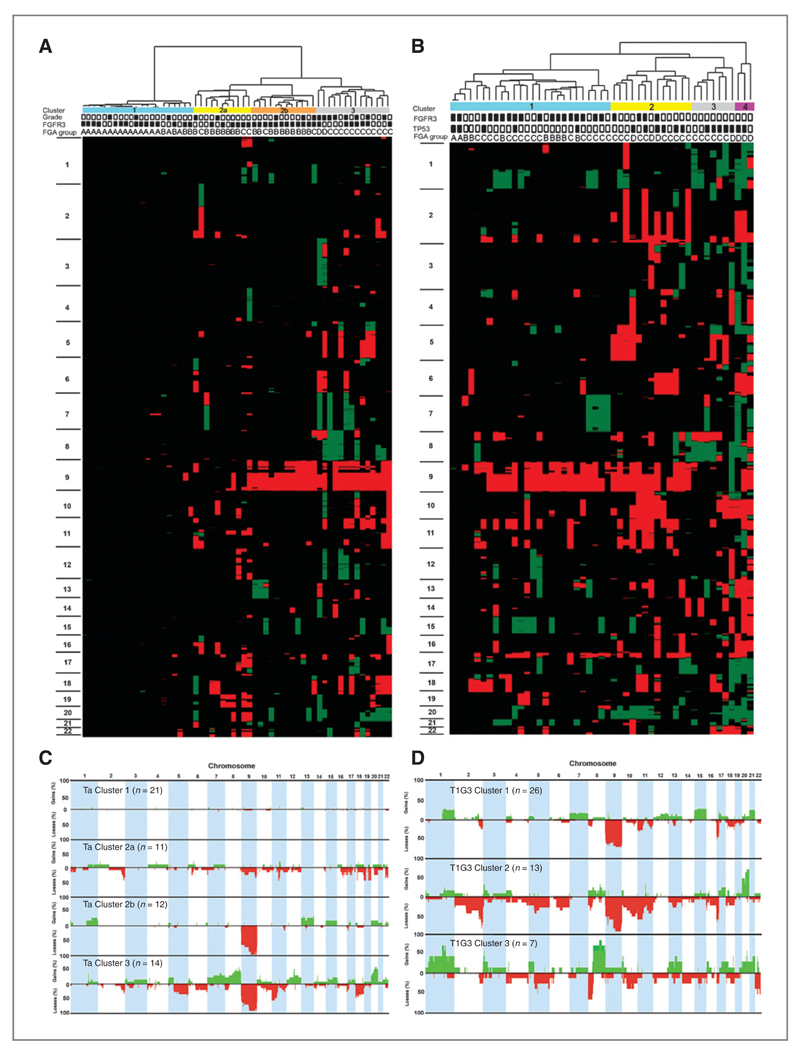
Results: Our findings point to the existence of genomic subclasses of the "gold-standard" grade/stage groups. The T1G3 tumors separated into 3 major subgroups that differed with respect to the type and number of copy number events and to FGFR3 and TP53 mutation status. We also identified novel regions of copy number alteration, uncovered relationships between molecular events, and elucidated relationships between molecular events and clinico-pathologic features. FGFR3 mutant tumors were more chromosomally stable than their wild-type counterparts and a mutually exclusive relationship between FGFR3 mutation and overrepresentation of 8q was observed in non-muscle-invasive tumors. In muscle-invasive (MI) tumors, metastasis was positively associated with losses of regions on 10q (including PTEN), 16q and 22q, and gains on 10p, 11q, 12p, 19p, and 19q. Concomitant copy number alterations positively associated with TP53 mutation in MI tumors were losses on 16p, 2q, 4q, 11p, 10q, 13q, 14q, 16q, and 19p, and gains on 1p, 8q, 10q, and 12q. Significant complexity was revealed in events affecting chromosome 9.

Conclusions: These findings may lead to improved biologic understanding and the development of prognostic biomarkers. Novel regions of copy number alteration may reveal potential therapeutic targets.


Conflict of interest statement

of Potential Confiicts of Interest No potential conflicts of interest were disclosed.

Figures

Figure 1
Figure 1
Genome-wide frequency plots of copy number alterations identified in 160 bladder tumors. Regions of chromosomal copy number imbalance were identified using the aCGH-smooth algorithm within BlueFuse. The smoothed log2 ratio values generated from these analyses were used as input values for the Nexus software package. The x-axis corresponds to chromosomes 1 to 22 and the y-axis corresponds to the percentage of gains and losses. Copy number gains are shown in green and losses in red. Frequencies of copy number alterations for all tumors, and according to stage and grade are shown.
Figure 2
Figure 2
CDKN2A copy number loss, TP53 mutation status, metastasis and genome-wide comparisons of copy number alterations in ≥T2 tumors. Genome-wide frequency plots of copy number alterations in (A) tumors with (n = 24) and without (n = 16) loss of copy number in the CDKN2A region, (B) TP53 wild type (WT; n = 18) and mutant (n = 24) tumors, and (C) tumors from patients that did (n = 18) or did not (n = 24) develop metastases. Significant regions (0.05 P value cutoff) of copy number gain (green) and loss (red) positively associated with copy number loss in the CDKN2A region, TP53 mutation or metastasis are highlighted at the bottom of each figure. Two tumors with increased copy number in the CDKN2A region were not included in the analyses.
Figure 3
Figure 3
FGFR3 mutation status, FGA, and genome-wide comparisons of copy number alterations. A, FGA (%) values and FGFR3 mutation status according to stage and grade. B, genome-wide frequency plots of copy number alterations in FGFR3 wild type (WT; n = 27) and mutant T1G3 tumors (n = 22).
Figure 4
Figure 4
Unsupervised hierarchical cluster analysis of aCGH data and genome-wide frequency plots of copy number alterations in individual clusters from stage Ta and T1G3 tumors. Each tumor was scored for copy number gains and losses and these were assigned a copy number class (2 high-level gain, 1 gain, 0 no change, −1 loss, −2 high-level loss). Copy number class data was used in 1-way hierarchical cluster analysis of (A) 58 stage Ta and (B) 49 T1G3 tumors. Each column of the heat map represents 1 sample and each row represents the genomic position of individual clones on the array. Green, copy number gain; red, copy number loss. Chromosome number is shown on the left-hand side of the heat map. Four main clusters of Ta tumors were identified and these are indicated by the color bars at the top of panel (A): Cluster 1, blue; Cluster 2a, yellow; Cluster 2b, orange; Cluster 3, gray. The grade of each tumor is shown at the top of the figure (black box, G3; white box, G1/G2) along with FGFR3 mutation status (back box, mutant; white box, wild type) and FGA group (A–D). Four clusters of T1G3 tumors were identified and these are indicated by the color bars at the top of panel (B): Cluster 1, blue; Cluster 2, yellow; Cluster 3, gray; Cluster 4, purple. The TP53 and FGFR3 mutation status of each tumor is also shown at the top of the figure (black box, mutant; white box, wild type) along with FGA group (A–D). C and D, frequency plots of copy number events for individual Ta clusters and T1G3 clusters with copy number gains shown in green and losses in red. T1G3 Cluster 4 consisted of only 3 samples therefore frequency data is not presented.

References

    1. Montie JE, Clark PE, Eisenberger MA, El-Galley R, Greenberg RE, Herr HW, et al. Bladder cancer. J Natl Compr Canc Netw. 2009;7:8–39. - PubMed
    1. López-Knowles E, Hernández S, Malats N, Kogevinas M, Lloreta J, Carrato A, et al. PIK3CA mutations are an early genetic alteration associated with FGFR3 mutations in superficial papillary bladder tumors. Cancer Res. 2006;66:7401–4. - PubMed
    1. Wu XR. Urothelial tumorigenesis: a tale of divergent pathways. Nat Rev Cancer. 2005;5:713–25. - PubMed
    1. Knowles MA. Molecular subtypes of bladder cancer: Jekyll and Hyde or chalk and cheese? Carcinogenesis. 2006;27:361–73. - PubMed
    1. Catto JW, Alcaraz A, Bjartell AS, De Vere White R, Evans CP, Fussel S, et al. MicroRNA in prostate, bladder, and kidney cancer: a systematic review. Eur Urol. 2011;59:671–81. - PubMed

Publication types