. 2012 Nov 15;18(22):6110-21.
doi: 10.1158/1078-0432.CCR-12-2130. Epub 2012 Aug 29.

IDO expression in brain tumors increases the recruitment of regulatory T cells and negatively impacts survival

Affiliations

IDO expression in brain tumors increases the recruitment of regulatory T cells and negatively impacts survival

Derek A Wainwright et al. Clin Cancer Res. .

Abstract

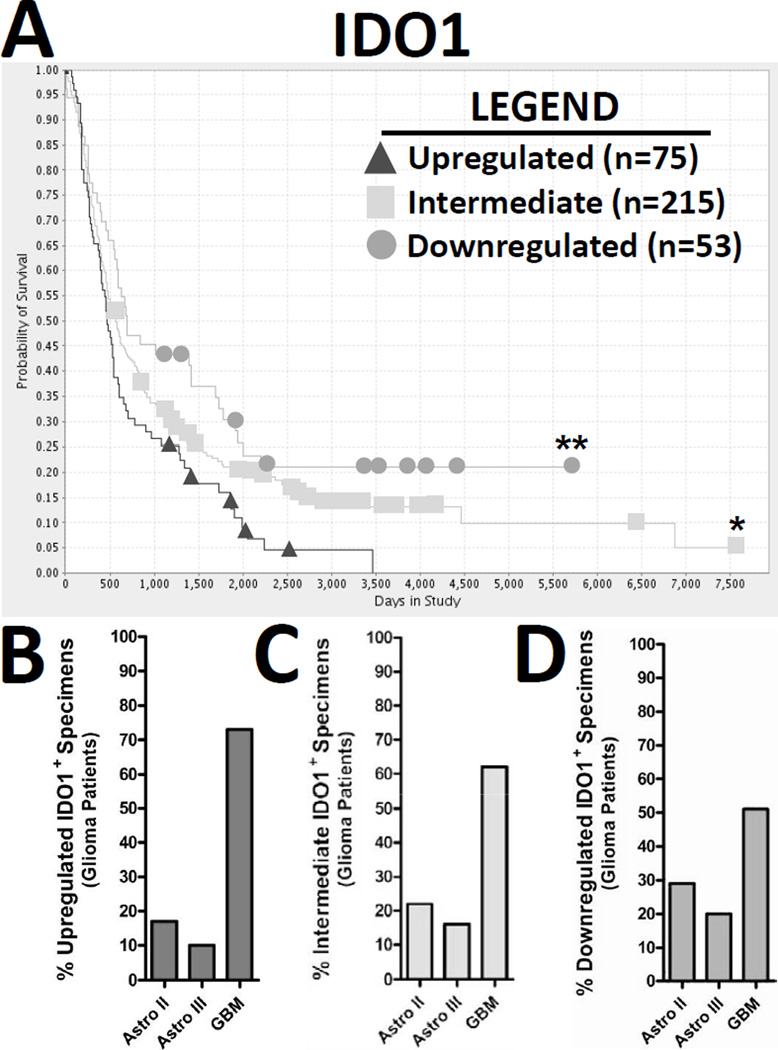
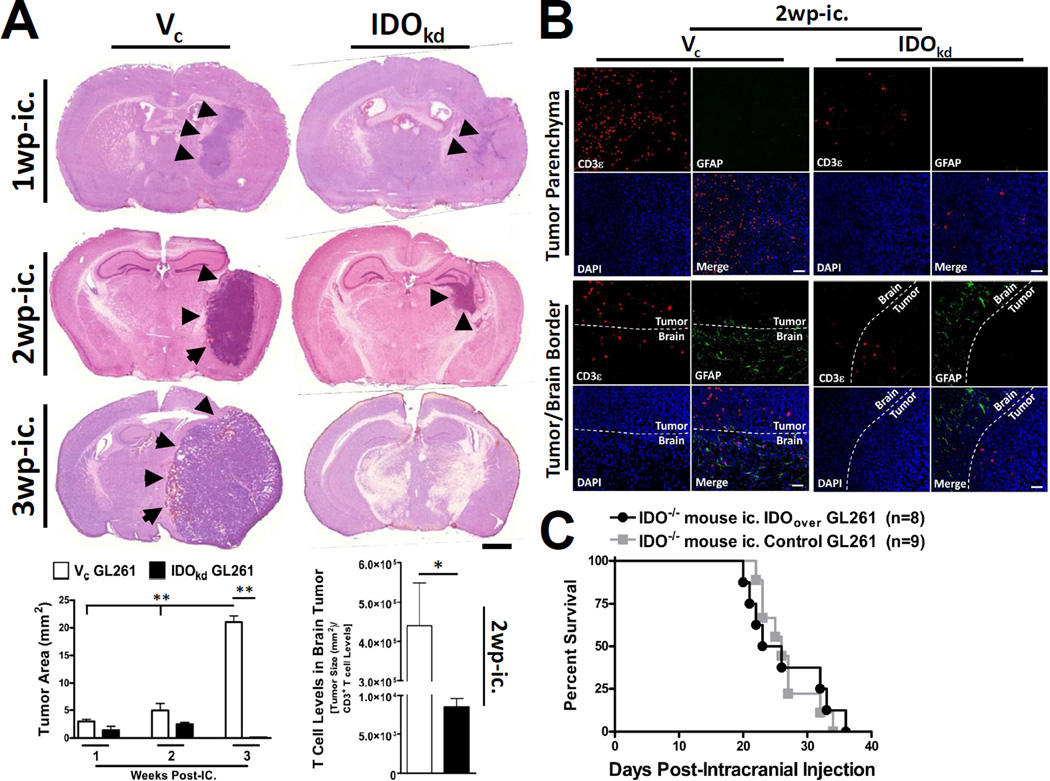
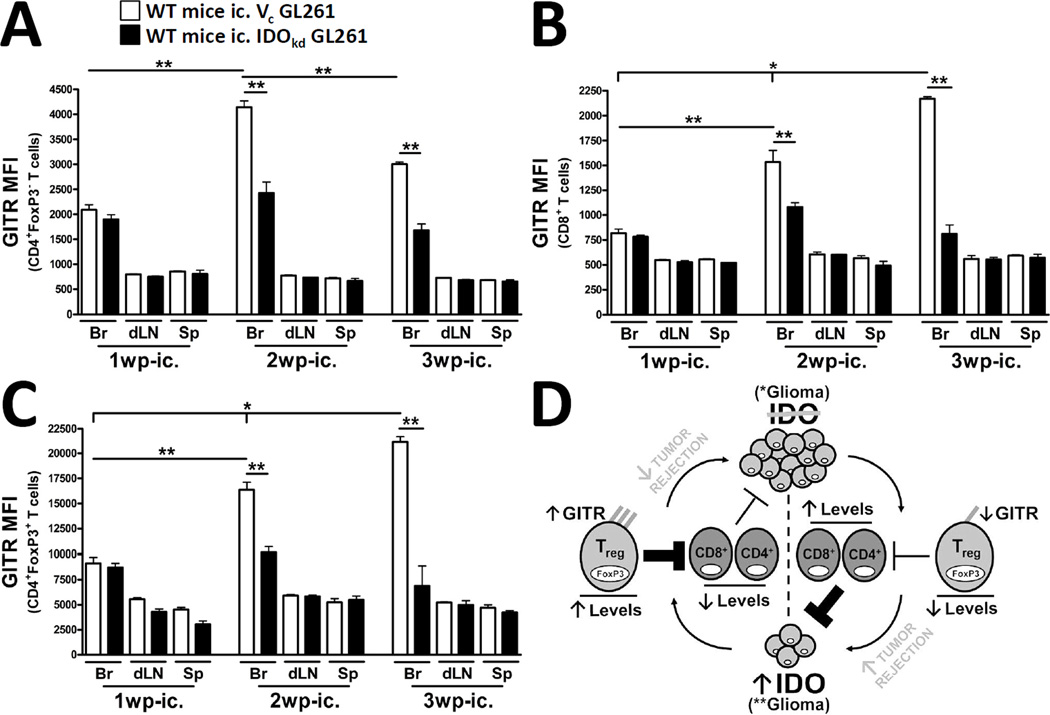
Purpose: Glioblastoma multiforme (GBM) is an aggressive adult brain tumor with a poor prognosis. One hallmark of GBM is the accumulation of immunosuppressive and tumor-promoting CD4(+)FoxP3(+)GITR(+) regulatory T cells (Tregs). Here, we investigated the role of indoleamine 2,3 dioxygenase (IDO) in brain tumors and the impact on Treg recruitment.

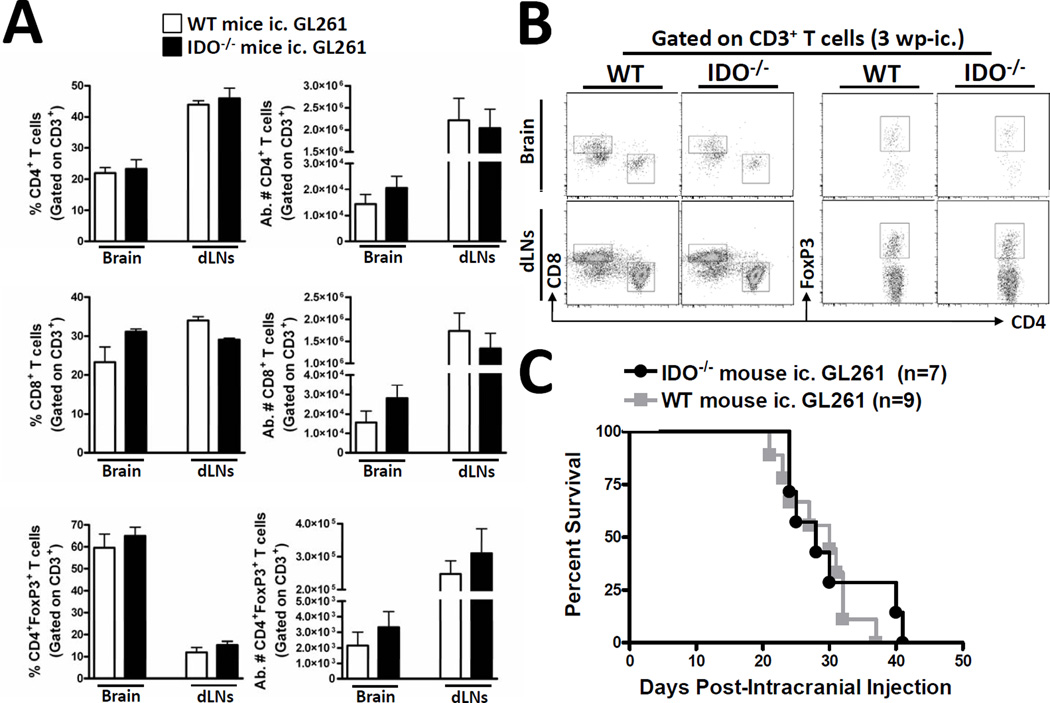
Experimental design: To determine the clinical relevance of IDO expression in brain tumors, we first correlated patient survival to the level of IDO expression from resected glioma specimens. We also used novel orthotopic and transgenic models of glioma to study how IDO affects Tregs. The impact of tumor-derived and peripheral IDO expression on Treg recruitment, GITR expression, and long-term survival was determined.

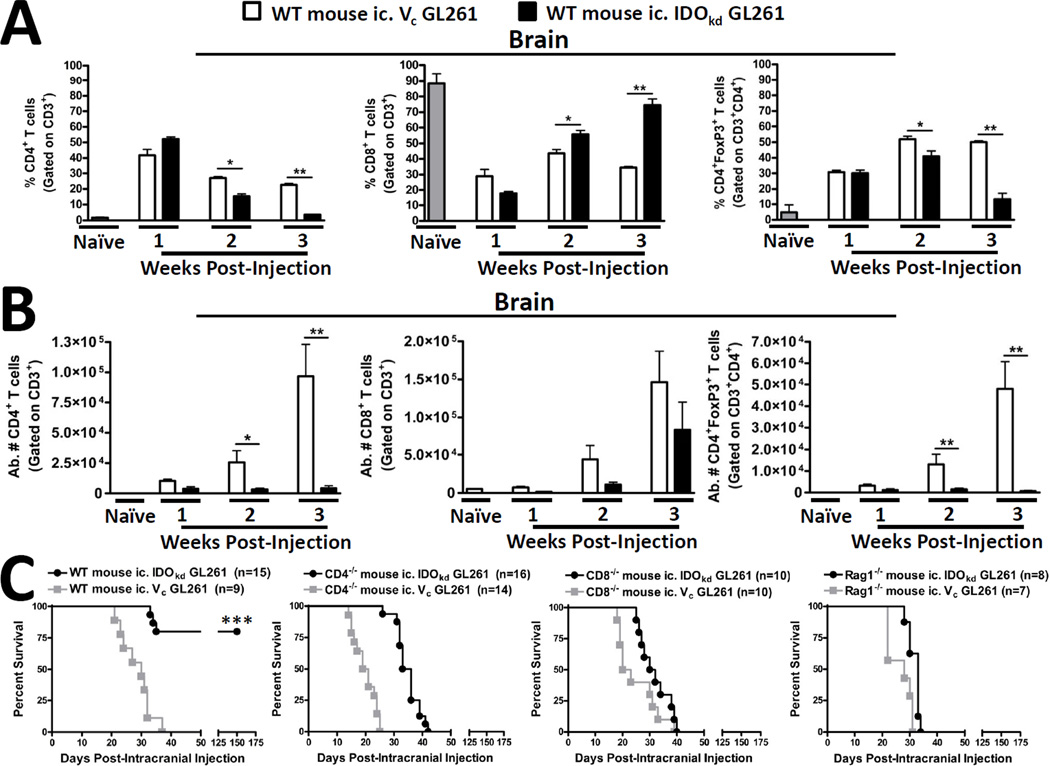
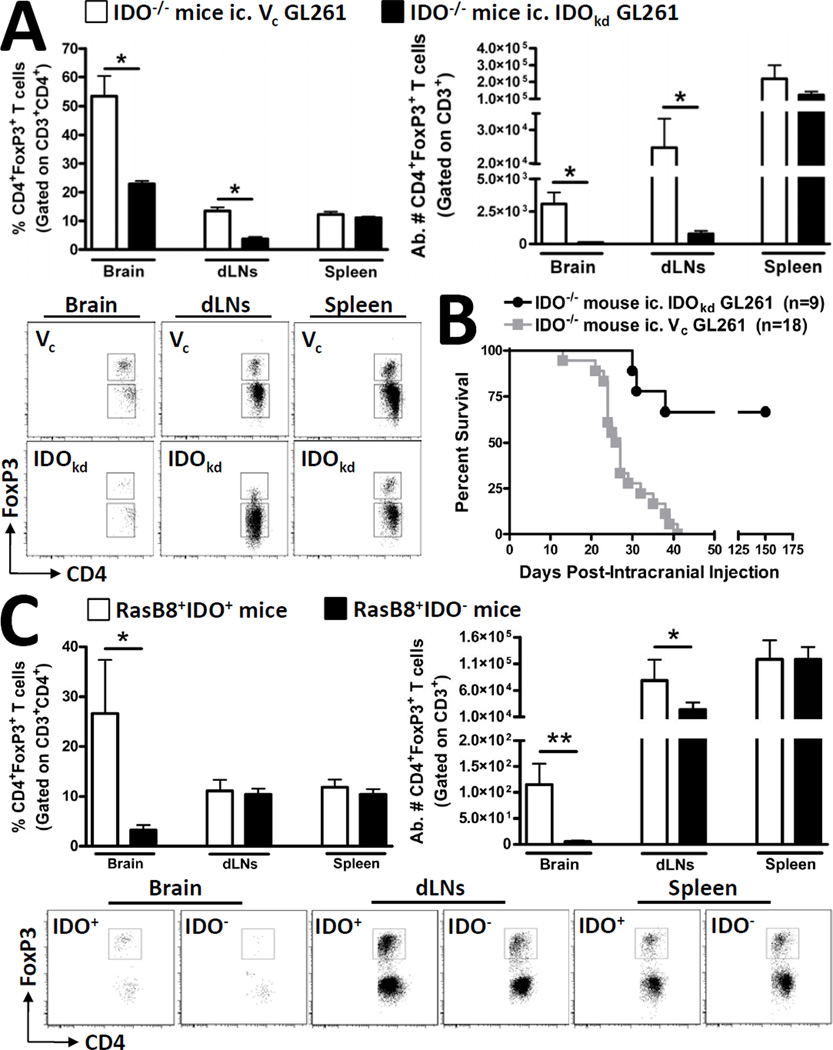
Results: Downregulated IDO expression in glioma predicted a significantly better prognosis in patients. Coincidently, both IDO-competent and deficient mice showed a survival advantage bearing IDO-deficient brain tumors, when compared with IDO-competent brain tumors. Moreover, IDO deficiency was associated with a significant decrease in brain-resident Tregs, both in orthotopic and transgenic mouse glioma models. IDO deficiency was also associated with lower GITR expression levels on Tregs. Interestingly, the long-term survival advantage conferred by IDO deficiency was lost in T-cell-deficient mice.

Conclusions: These clinical and preclinical data confirm that IDO expression increases the recruitment of immunosuppressive Tregs that lead to tumor outgrowth. In contrast, IDO deficiency decreases Treg recruitment and enhances T-cell-mediated tumor rejection. Thus, the data suggest a critical role for IDO-mediated immunosuppression in glioma and support the continued investigation of IDO-Treg interactions in the context of brain tumors.


Conflict of interest statement

Conflict of Interest Disclosure: The authors declare that no competing interests exist.

Figures

Figure 1
Figure 1. The upregulation of IDO in glioma is associated with a decreased overall lifespan in patients
Data was isolated from the Repository of Molecular Brain Neoplasia Data (REMBRANDT) and represents the analysis of 343 different glioma patients. (A) The Kaplan-Meier survival curve for IDO1 was plotted for upregulated (triangle), intermediate (square) and downregulated (circle) expression over time. (B) Upregulated, (C) intermediate and (D) downregulated IDO expression in glioma was correlated to the percentage of grade II (Astro II), grade III (Astro III) or glioblastoma multiforme [(GBM) grade IV astrocytoma]. *p < 0.05; **p < 0.005
Figure 2
Figure 2. Peripheral IDO deficiency has no effect on brain tumor-infiltrating T cell levels and survival
Wild-type (WT) (white bars) or indoleamine 2,3 dioxygenase 1-deficient (IDO−/−; black bars) mice were intracranially-injected 4×10⁵ normal GL261 cells. The frequency and absolute numbers of (A) total CD4+ T cells, CD8+ T cells and CD4+FoxP3+ regulatory T cells isolated from the brain and bilateral deep and superficial cervical draining lymph nodes (dLN) of tumor-bearing mice were analyzed at 3 weeks post-intracranial injection (wp-ic). All T cell populations were initially identified by the expression of CD3. (B) Representative flow cytometric plots demonstrate the gating strategy utilized for the identification of total CD3+CD4+, CD3+CD8+ and CD3+CD4+FoxP3+ T cells. Bar graphs in figure A are shown as mean ± SEM and are representative of two independent experiments (n = 3 – 5 mice/group). (C) The Kaplan-Meier curve represents mouse survival times over a time course of 50 days (n = 7 – 9 mice/group).
Figure 3
Figure 3. The presence or absence of brain tumor-derived IDO contextually regulates T cell infiltration and long-term survival in T cell -competent, but not -deficient mice
Wild-type (WT) mice were intracranially-injected (ic.) 4×10⁵ GL261 cells transduced with -scrambled shRNA (vector control, Vc; white bars) or -shRNA specific to IDO (IDO knockdown, IDOkd; black bars). Naïve (control; grey bars) mice were used as a baseline of normal T cell levels in the brain. The (A) frequency and (B) absolute numbers of total CD4+ T cells, CD8+ T cells and CD4+FoxP3+ regulatory T cells isolated from the brain of tumor-bearing mice were analyzed from naïve, or at 1, 2 and 3 weeks post-injection. All T cell populations were initially identified by the expression of CD3. Bar graphs in figures A – B are shown as mean ± SEM and are representative of two independent experiments (n = 4 – 5 mice/group). Kaplan-Meier survival curves for (C) WT, CD4-deficient (CD4−/−; lack CD4+ T cells), CD8-deficient (CD8−/−; lack CD8+ T cells) and recombinase activating gene 1-deficient (Rag1−/−; lack all functional T or B cells) mice ic. 4×10⁵ Vc or IDOkd GL261 cells. Mouse survival was analyzed for up to 150 days (n = 7 – 16 mice/group) and reflects the pooled data resulting from 2 – 3 independent experiments. *p < 0.05; **p < 0.01; ***p < 0.001.
Figure 4
Figure 4. Global IDO-deficiency affects Treg levels in brain tumors and draining lymph nodes without effects in the spleen
Indoleamine 2,3 dioxygenase 1-deficient (IDO−/−) mice were intracranially-injected (ic.) 4×10⁵ GL261 cells transduced with -scrambled shRNA (vector control, Vc; white bars) or -shRNA specific to IDO (IDO knockdown, IDOkd; black bars). The (A) frequency and absolute numbers of CD4+FoxP3+ regulatory T cells isolated from brain, ipsilateral deep and superficial cervical draining lymph nodes (dLN) and spleen of tumor-bearing mice were analyzed at 3 weeks post-intracranial injection (wp-ic). Representative flow cytometric plots demonstrate the gating strategy utilized for the identification of total CD3+CD4+FoxP3+ Tregs in the GL261-cell based orthotopic glioma mouse model. (B) The Kaplan-Meier curve represents mouse survival times over a time course of 150 days (n = 9 – 18 mice/group) and represent the combined data from 3 independent experiments. (C) RasB8 mice that were IDO -competent (white bars) or -deficient were analyzed for the frequency and (E) absolute numbers of Tregs. Representative flow cytometric plots demonstrate the gating strategy utilized for the identification of total CD3+CD4+FoxP3+ Tregs in the RasB8 transgenic glioma mouse model. For all experiments, Tregs were initially first identified for the co-expression of CD3 and CD4, prior to FoxP3. Bar graphs in figures A and C are shown as mean ± SEM and are representative of two independent experiments (n = 3 – 5 mice/group). *p < 0.05; **p < 0.01; ***p < 0.001.
Figure 5
Figure 5. The expression of IDO in brain tumors is associated with increased T cell infiltration
(A) Indoleamine 2,3 dioxygenase 1-deficient (IDO−/−) mice were intracranially-injected (ic.) 4×10⁵ GL261 cells transduced with -scrambled shRNA (vector control, Vc; white bars) or -shRNA specific to IDO (IDO knockdown, IDOkd; black bars). Mice were euthanized at 1, 2 or 3 weeks post-intracranial injection (wp-ic.), brains were flash frozen and systematically sectioned throughout the tumor injection site. Brain sections were stained with hematoxylin and eosin and scanned by the CRi Pannoramic Whole Slide Scanner. In each section, tumors (black arrows) were traced using the Pannoramic Viewer software and the area was digitally calculated. Scale bar = 1mm. Bar graphs representing the Vc (white bars) and IDOkd (black bars) median tumor volume are represented for the 1, 2 and 3 wp-ic. time points. The 2 wp-ic. tumor volumes were then divided by the absolute amount of CD3+ T cells based on flow cytometric quantification. Bar graphs are shown as mean±SEM (n=4 mice/group). (B) Fluorescent microscopy for CD3 and glial fibrillary acidic protein (GFAP) expression, as well as nuclear DAPI staining, was performed in IDO−/− mice ic. Vc and IDOkd GL261 cells at 2 wp-ic. Photomicrographs of the deep tumor parenchyma (top panel) or at the tumor/brain border (bottom panel) were imaged at 20× magnification. Bars, 50 μm. (C) IDO−/− mice were intracranially-injected (ic.) 4×10⁵ GL261 cells transfected the pEF6 vector alone (control) or the pEF6 vector with an inserted IDO cassette (IDO-overexpressing, IDOover). *p < 0.05; **p < 0.01.
Figure 6
Figure 6. Brain tumor-expressed IDO upregulates GITR levels on tumor-infiltrating T cells
Wild-type (WT) mice were intracranially-injected (ic.) 4×10⁵ GL261 cells transduced with -scrambled shRNA (vector control, Vc; white bars) or -shRNA specific to IDO (IDO knockdown, IDOkd; black bars). The mean fluorescence intensity of GITR expressed by (A) CD4+FoxP3 T cells, (B) CD8+ T cells and (C) CD4+FoxP3+ regulatory T cells isolated from the brains, ipsilateral cervical draining lymph nodes (dLN) and spleen of tumor-bearing mice were analyzed at 1, 2 and 3 weeks post-injection. All T cell populations were initially identified by the expression of CD3. Bar graphs in figures A – C are shown as mean ± SEM and are representative of two independent experiments (n = 5 mice/group). (D) When IDO is absent from brain tumors, GITR expression remains low on infiltrating T cells. Moreover, while Treg levels remain decreased, CD4+ non-Tregs and CD8+ cytotoxic T cells are increased, resulting in effective tumor rejection. Reciprocally, when IDO is expressed, GITR expression is upregulated on infiltrating T cells; this is particularly evident on Tregs. This is co-incident with a significant increase in the ratio of Tregs, when compared to CD4+ non-Tregs and CD8+ cytotoxic T cells. The increased fraction of immunosuppressive Tregs is then associated with decreased tumor rejection and increased outgrowth. *p < 0.05; **p < 0.01.

Comment in

References

    1. Stupp R, Mason WP, van den Bent MJ, Weller M, Fisher B, Taphoorn MJ, et al. Radiotherapy plus concomitant and adjuvant temozolomide for glioblastoma. New Engl Jour Med. 2005;352:987–996. - PubMed
    1. El Andaloussi A, Lesniak MS. An increase in CD4+CD25+FOXP3+ regulatory T cells in tumor-infiltrating lymphocytes of human glioblastoma multiforme. Neuro Oncol. 2006;8:234–243. - PMC - PubMed
    1. El Andaloussi A, Han Y, Lesniak MS. Prolongation of survival following depletion of CD4+CD25+ regulatory T cells in mice with experimental brain tumors. J Neurosurg. 2006;105:430–437. - PubMed
    1. Fecci PE, Mitchell DA, Whitesides JF, Xie W, Friedman AH, Archer GE, et al. Increased regulatory T-cell fraction amidst a diminished CD4 compartment explains cellular immune defects in patients with malignant glioma. Cancer Res. 2006;66:3294–3302. - PubMed
    1. Wainwright DA, Sengupta S, Han Y, Lesniak MS. Thymus-derived rather than tumor-induced regulatory T cells predominate in brain tumors. Neuro Oncol. 2011;13:1308–1323. - PMC - PubMed

Publication types

MeSH terms

Substances