

Cochlear implantation in older adults
- PMID: 22932787
- PMCID: PMC3518393
- DOI: 10.1097/MD.0b013e31826b145a
Cochlear implantation in older adults
Abstract
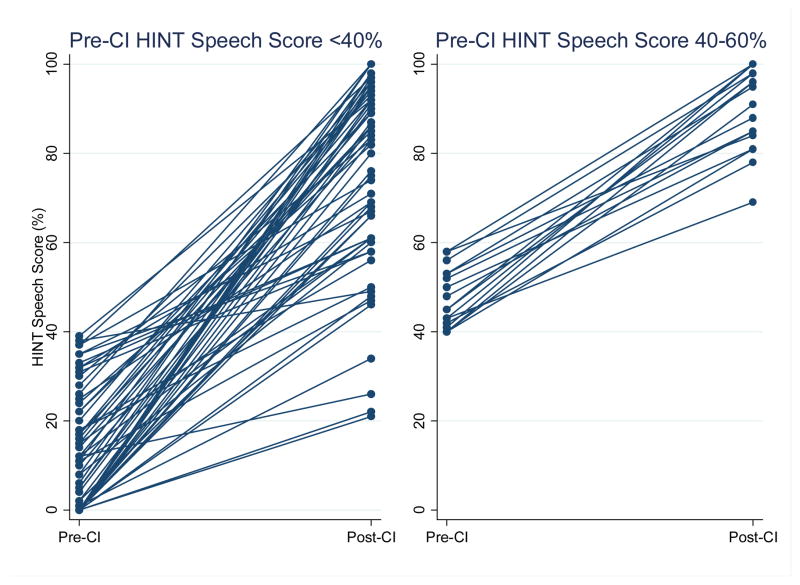
Cochlear implants allow individuals with severe to profound hearing loss access to sound and spoken language. The number of older adults in the United States who are potential candidates for cochlear implantation (CI) is approximately 150,000 and will continue to increase with the aging of the population. Should CI be routinely recommended for these older adults, and do these individuals benefit from CI? We reviewed our 12-year experience with CI in adults aged ≥60 years (n = 445) at Johns Hopkins Medical Institutions to investigate the impact of CI on speech understanding and to identify factors associated with speech performance. Complete data on speech outcomes at baseline and 1 year post-CI were available for 83 individuals. Our results demonstrate that CI in adults aged ≥60 years consistently improved speech understanding scores, with a mean increase of 60.0% (SD 24.1) on HINT (Hearing in Noise Test) sentences in quiet. The magnitude of the gain in speech scores was negatively associated with age at implantation, such that for every increasing year of age at CI the gain in speech scores was 1.3 percentage points less (95% confidence interval [95% CI], 0.6-1.9) after adjusting for age at hearing loss onset. Conversely, individuals with higher pre-CI speech scores (HINT scores between 40% and 60%) had significantly greater post-CI speech scores by a mean of 10.0 percentage points (95% CI, 0.4-19.6) than those with lower pre-CI speech scores (HINT <40%) after adjusting for age at CI and age at hearing loss onset. These results suggest that older adult CI candidates who are younger at implantation and with higher preoperative speech scores obtain the highest speech understanding scores after CI, with possible implications for current United States Medicare policy. Finally, we provide an extended discussion of the epidemiology and impact of hearing loss in older adults. Future research of CI in older adults should expand beyond simple speech outcomes to take into account the broad cognitive, social, and physical functioning outcomes that are likely detrimentally affected by hearing loss and may be mitigated by CI.
Conflict of interest statement
Potential conflict of interest: None reported
Figures


References
-
- Agrawal Y, Platz EA, Niparko JK. Prevalence of hearing loss and differences by demographic characteristics among US adults: data from the National Health and Nutrition Examination Survey, 1999–2004. Arch Intern Med. 2008;168:1522–1530. - PubMed
-
- Appollonio I, Carabellese C, Frattola L, Trabucchi M. Effects of sensory aids on the quality of life and mortality of elderly people: a multivariate analysis. Age Ageing. 1996;25:89–96. - PubMed
-
- Ates NA, Unal M, Tamer L, Derici E, Karakas S, Ercan B, Pata YS, Akbas Y, Vayisoglu Y, Camdeviren H. Glutathione S-transferase gene polymorphisms in presbycusis. Otol Neurotol. 2005;26:392–397. - PubMed
-
- Barnes DE, Cauley JA, Lui LY, Fink HA, McCulloch C, Stone KL, Yaffe K. Women who maintain optimal cognitive function into old age. J Am Geriatr Soc. 2007;55:259–264. - PubMed
-
- Barnes LL, Mendes de Leon CF, Wilson RS, Bienias JL, Evans DA. Social resources and cognitive decline in a population of older African Americans and whites. Neurology. 2004;63:2322–2326. - PubMed
Publication types
MeSH terms
Grants and funding
LinkOut - more resources
Full Text Sources
