. 2012 Oct 19;287(43):36158-67.
doi: 10.1074/jbc.M112.382085. Epub 2012 Aug 29.

Dual effect of phosphatidylinositol (4,5)-bisphosphate PIP(2) on Shaker K(+) [corrected] channels

Affiliations

Dual effect of phosphatidylinositol (4,5)-bisphosphate PIP(2) on Shaker K(+) [corrected] channels

Fayal Abderemane-Ali et al. J Biol Chem. .

Erratum in

  • J Biol Chem. 2013 Apr 12;288(15):10951

Abstract

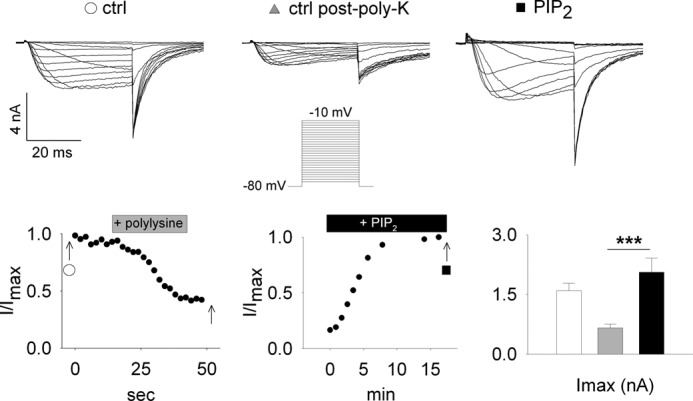
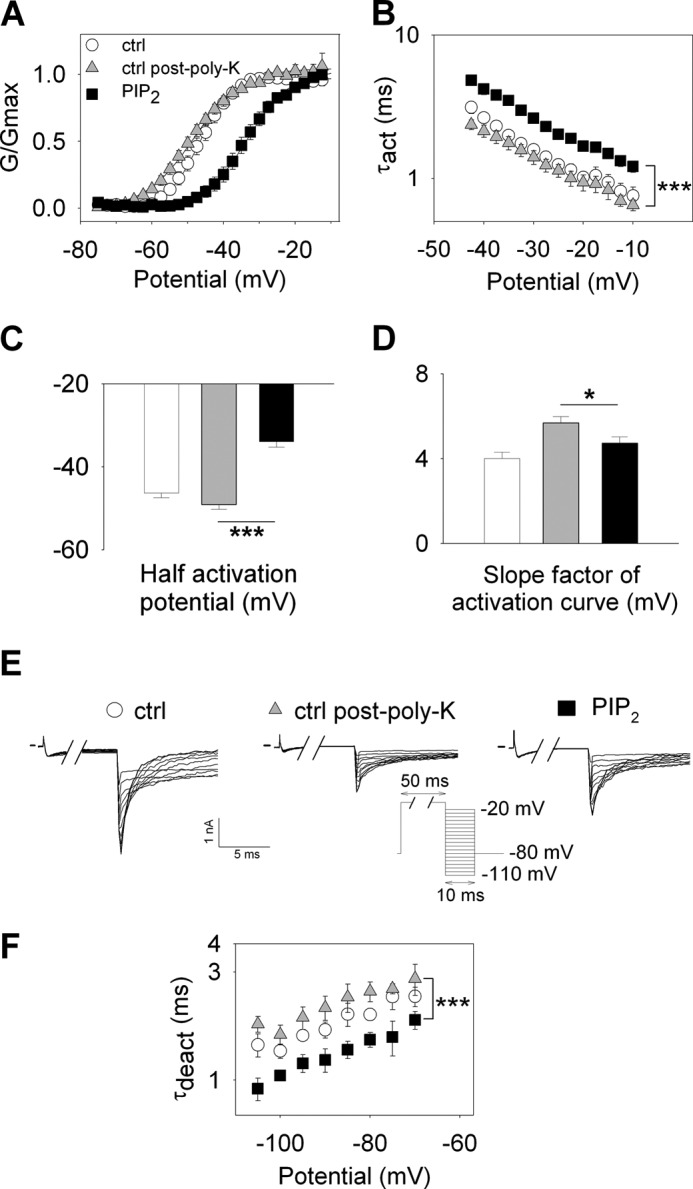
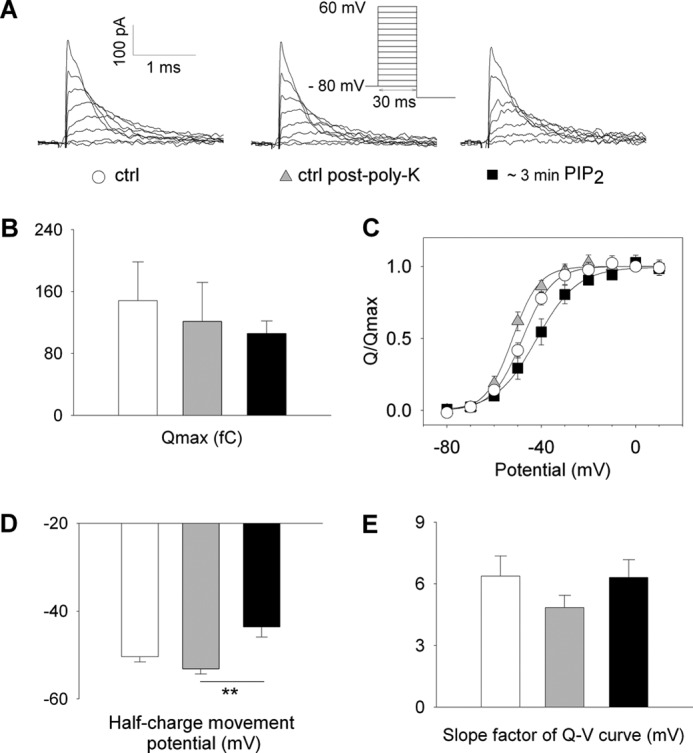
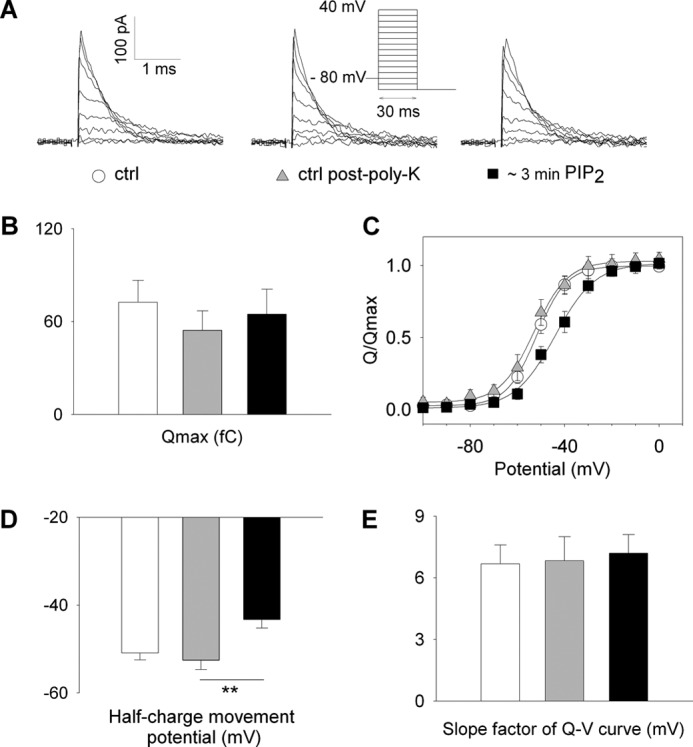
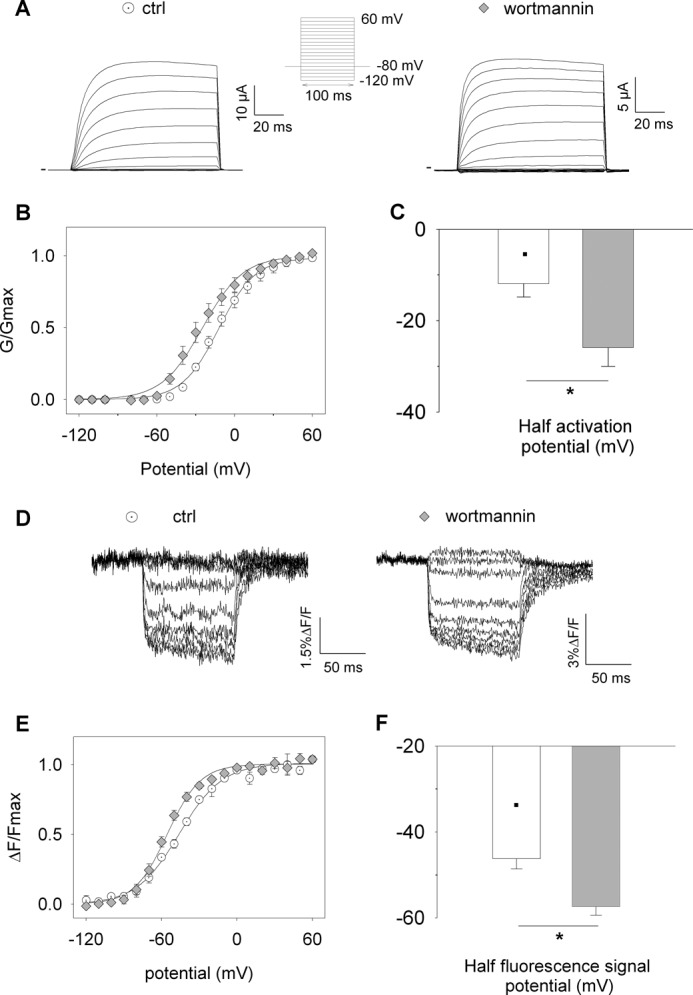
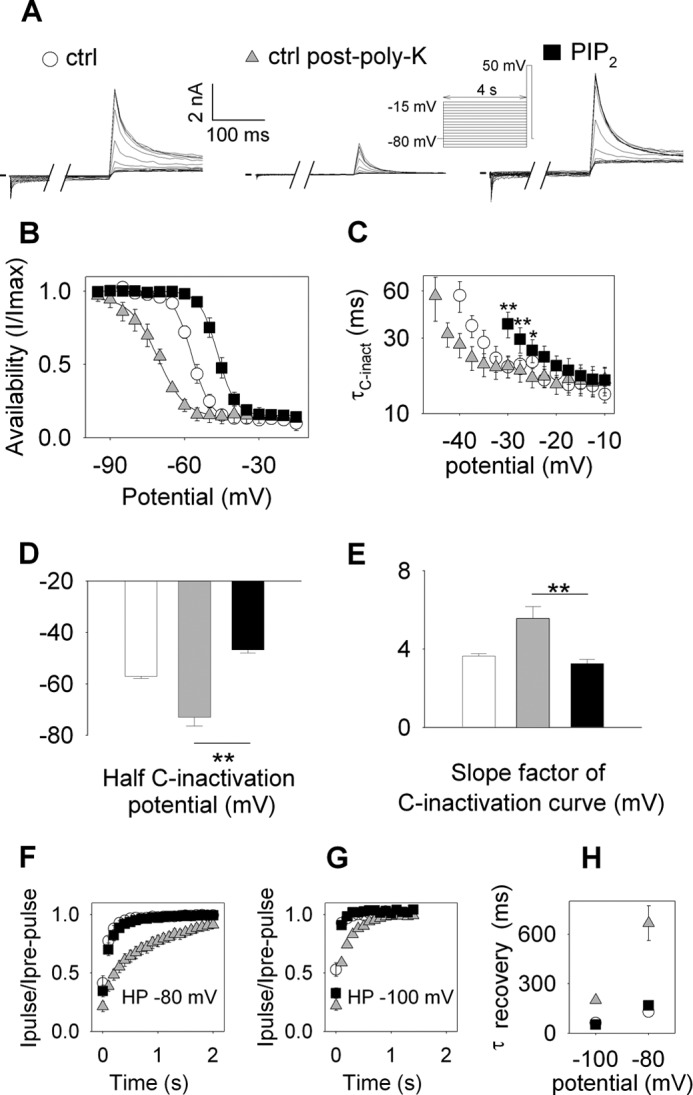
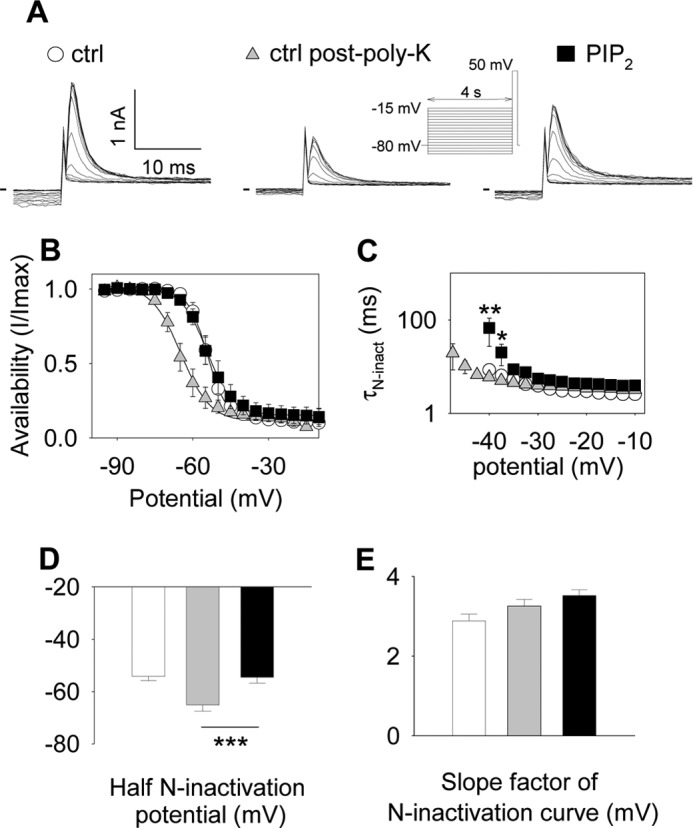
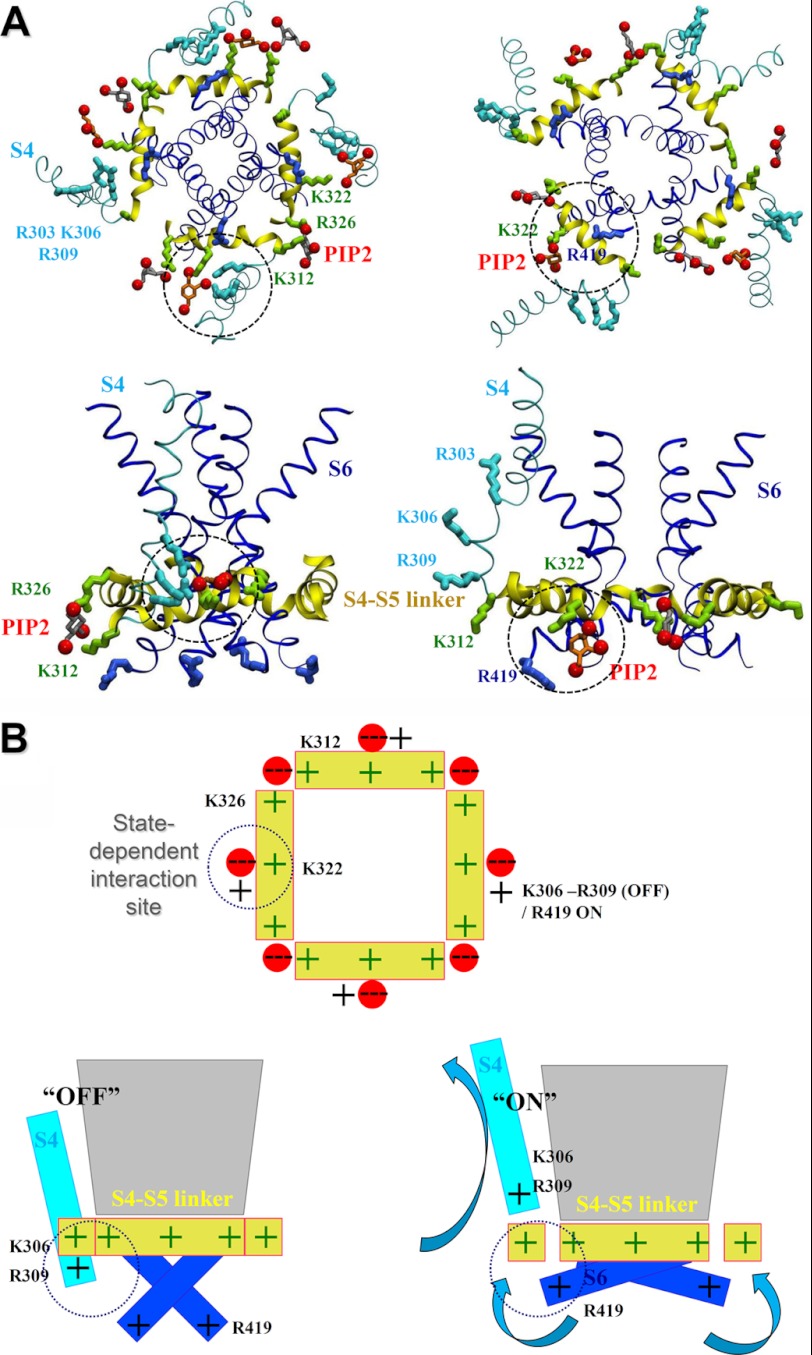
Phosphatidylinositol (4,5)-bisphosphate (PIP(2)) is a phospholipid of the plasma membrane that has been shown to be a key regulator of several ion channels. Functional studies and more recently structural studies of Kir channels have revealed the major impact of PIP(2) on the open state stabilization. A similar effect of PIP(2) on the delayed rectifiers Kv7.1 and Kv11.1, two voltage-gated K(+) channels, has been suggested, but the molecular mechanism remains elusive and nothing is known on PIP(2) effect on other Kv such as those of the Shaker family. By combining giant-patch ionic and gating current recordings in COS-7 cells, and voltage-clamp fluorimetry in Xenopus oocytes, both heterologously expressing the voltage-dependent Shaker channel, we show that PIP(2) exerts 1) a gain-of-function effect on the maximal current amplitude, consistent with a stabilization of the open state and 2) a loss-of-function effect by positive-shifting the activation voltage dependence, most likely through a direct effect on the voltage sensor movement, as illustrated by molecular dynamics simulations.


Figures

FIGURE 1.
FIGURE 1.
Rundown of Shaker-IR currents and reversal by PIP2 application. Upper panel, representative Shaker-IR currents obtained from a giant patch of a transfected COS-7 cell in response to an activation protocol (inset) after excision (left panel, ctrl, empty circle), after a 25-s application of 25 μg/ml polylysine (middle panel, ctrl post-poly-K, gray triangle), and at steady state, after ∼15 min of PIP2 (5 μm) application (right panel, PIP2, dark square). Lower panel, left, kinetics of relative peak tail-current amplitude from a representative cell, showing a slight rundown that is increased by addition of poly-K. Middle, time course of ion current from a representative cell, showing an increase in the current upon addition of PIP2. Right, maximal full activation current amplitudes at −10 mV obtained by fitting both activation and inactivation phases with Equation 1 (see “Experimental Procedures”). Mean of maximal current at −10 mV obtained from 15 patches (***, p < 0.001).
FIGURE 2.
FIGURE 2.
Modification of Shaker-IR activation properties in presence of PIP2. A, mean relative conductance-voltage (G/GmaxV) relationships fitted with a Boltzmann function and obtained using the same protocol as in Fig. 1, upper panel (n = 15). B, mean activation time constants at different potentials, obtained from 15 patches (***, p < 0.001 PIP2 versus ctrl post-poly-K). C, mean half-activation potentials and D, slope factors of G/GmaxV curves (n = 15, *, p < 0.05). E, currents obtained from a giant patch of a representative transfected COS-7 cell with a tail protocol (shown as inset). F, deactivation time constants obtained by fitting relaxation of ion current upon repolarization with a single exponential (n = 8).
FIGURE 3.
FIGURE 3.
Effect of PIP2 on non conducting Shaker-IR gating current. A, representative Shaker-IR-W434F “On” gating currents obtained from a giant patch of a transfected COS-7 cell in response to an activation protocol (inset) after excision (left panel, ctrl, empty circle), after a 25-s application of 25 μg/ml polylysine (middle panel, ctrl post-poly-K, gray triangle) and at steady-state, after ∼3 min of PIP2 (5 μm) application (right panel, PIP2, dark square). B, mean total amount of gating charges moved at 60 mV (n = 8), (C) relative “ON” charge movement-voltage (Q-V) relationships fitted with a Boltzmann function (n = 8) and obtained using the same protocol as in A, (D) half-charge movement potential (**, p < 0.01) and (E) slope factor of activation curve.
FIGURE 4.
FIGURE 4.
Effect of PIP2 on nonconducting Shaker gating current. A, representative Shaker-W434F “On” gating currents obtained from a giant patch of a transfected COS-7 cell in response to an activation protocol (inset) after excision (left panel, ctrl, empty circle), after a 25-s application of 25 μg/ml polylysine (middle panel, ctrl post-poly-K, gray triangle) and at steady state, after ∼3 min of PIP2 (5 μm) application (right panel, PIP2, dark square). B, mean total amount of gating charges moved at 40 mV (n = 9), C, relative “ON” charge movement-voltage (Q-V) relationships fitted with a Boltzmann function (n = 9) and obtained using the same protocol as in A, (D) half-charge movement potential (**, p < 0.01) and (E) slope factor of activation curve.
FIGURE 5.
FIGURE 5.
Effect of PIP2 decrease on both ion and gating currents, probed by voltage-clamp fluorimetry. A and D, representative whole-cell recording of Shaker-IR-A359C-C445V ion currents (A) and fluorescence signal (D) obtained from an injected Xenopus oocyte in response to an activation protocol (inset, every 2 s). B, conductance-voltage (G-V) relationships fitted with a Boltzmann function (control n = 5 and wortmannin n = 4). C, half activation potentials (*, p < 0.05). E, fluorescence signal-voltage relationship was fitted with a Boltzmann function and obtained from the recordings as shown in D (control n = 3 and wortmannin n = 5). F, half-fluorescence signal potentials.
FIGURE 6.
FIGURE 6.
Effect of PIP2 on C-type inactivation of Shaker-IR channels. A, representative ion currents from a giant patch of a Shaker-IR transfected COS-7 cell, obtained with an inactivation protocol (inset, holding potential was −80 mV, pre-pulse during 4 s at various potentials, with 5-mV increments and pulse at 50 mV during 250 ms, every 5 s). B, inactivation curves, obtained by normalizing the test pulse maximum amplitudes, were fitted with a Boltzmann equation (n = 5). C, C-type inactivation time constants, obtained using Equation 1 to fit recordings as in Fig. 1, were plotted against voltage (n = 15, **, p < 0.01, *, p < 0.05). D, half-inactivation potentials and E, slope factors of inactivation curves (**, p < 0.01). F and G, recovery from inactivation. Pulse/prepulse relative amplitude plotted against time interval. HP: holding potential. H, recovery from inactivation kinetics (n = 6).
FIGURE 7.
FIGURE 7.
Effect of PIP2 on N-type inactivation of Shaker channels. A, representative ion currents from a giant patch of a Shaker-transfected COS-7 cell, obtained with an inactivation protocol (inset, holding potential was −80 mV, pre-pulse during 4 s at various potentials, with 5-mV increments and pulse at 50 mV during 250 ms, every 5 s). B, inactivation curves, obtained by normalizing the test pulse maximum amplitudes, were fitted with a Boltzmann equation (n = 7). C, N-type inactivation time constants, calculated by using equation 1 to fit Shaker recordings, obtained with an activation protocol (Fig. 1, inset), were plotted against voltage (n = 7, **, p < 0.01, *, p < 0.05). D, half-inactivation potentials and E, slope factors of inactivation curves (***, p < 0.001).
FIGURE 8.
FIGURE 8.
State-dependent interaction site for Kv1. 2/PIP2 revealed by atomistic MD simulations. Molecular model (A) and scheme (B) of the closed (left) and open (right) conformations of the channel. A, view from the intracellular side of the channel (Up) and from the side (Down). In both states, the head groups of two PIP2 molecules (depicted as red spheres) interact with the basic residues Lys-312 and Arg326 (green sticks) of the outermost regions of S4-S5 linker (yellow ribbon) and with Lys-322 located at the middle of the S4-S5 linker. At this site, PIP2 molecules interact with Lys-306 and Arg-309 of the bottom of S4 (cyan sticks and ribbon) in the closed state and with R419 (blue sticks) of the C terminus of S6 in the open state (state-dependent interaction site; dashed circle). The Kv1.2 S1 to S3 and S5 helices, and the lipids and solvent are not represented for clarity.

Similar articles

Cited by

References

    1. Hilgemann D. W., Feng S., Nasuhoglu C. (2001) The complex and intriguing lives of PIP2 with ion channels and transporters. Sci. STKE 2001, re19. - PubMed
    1. McLaughlin S., Wang J., Gambhir A., Murray D. (2002) PIP(2) and proteins: interactions, organization, and information flow. Annu. Rev. Biophys. Biomol. Struct. 31, 151–175 - PubMed
    1. Huang C. L., Feng S., Hilgemann D. W. (1998) Direct activation of inward rectifier potassium channels by PIP2 and its stabilization by G[β][γ]. Nature 391, 803–806 - PubMed
    1. Hilgemann D. W., Ball R. (1996) Regulation of cardiac Na+,Ca2+ exchange, and KATP potassium channels by PIP2. Science 273, 956–959 - PubMed
    1. Zhang H., Craciun L. C., Mirshahi T., Rohács T., Lopes C. M., Jin T., Logothetis D. E. (2003) PIP(2) activates KCNQ channels, and its hydrolysis underlies receptor-mediated inhibition of M currents. Neuron 37, 963–975 - PubMed

Publication types

MeSH terms

Substances

LinkOut - more resources