

Regulation of the Plasmodium motor complex: phosphorylation of myosin A tail-interacting protein (MTIP) loosens its grip on MyoA
- PMID: 22932904
- PMCID: PMC3481298
- DOI: 10.1074/jbc.M112.379842
Regulation of the Plasmodium motor complex: phosphorylation of myosin A tail-interacting protein (MTIP) loosens its grip on MyoA
Abstract
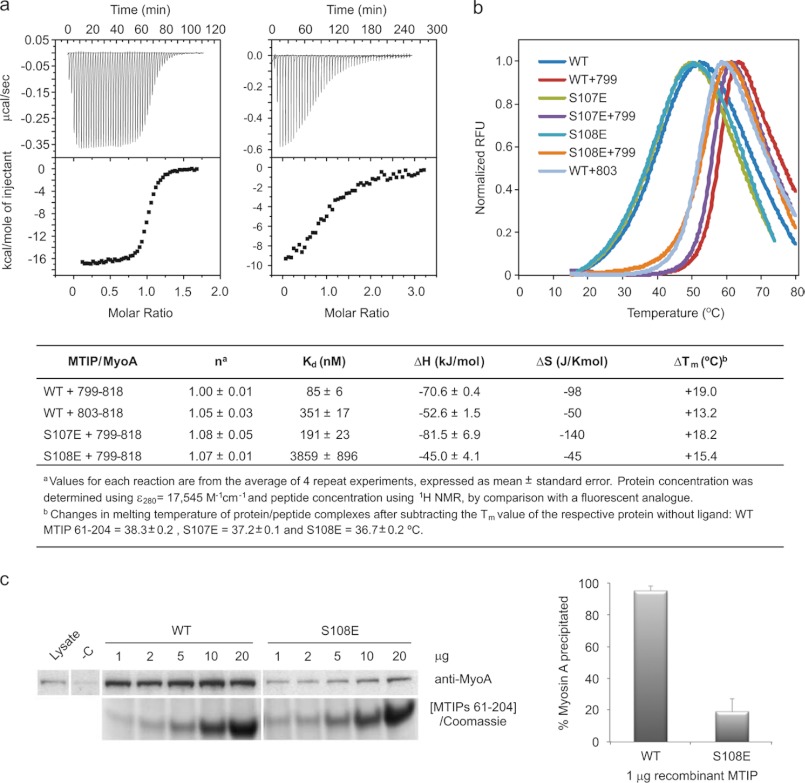
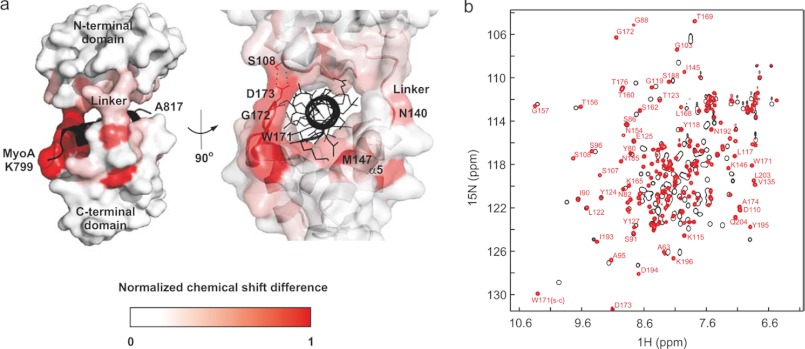
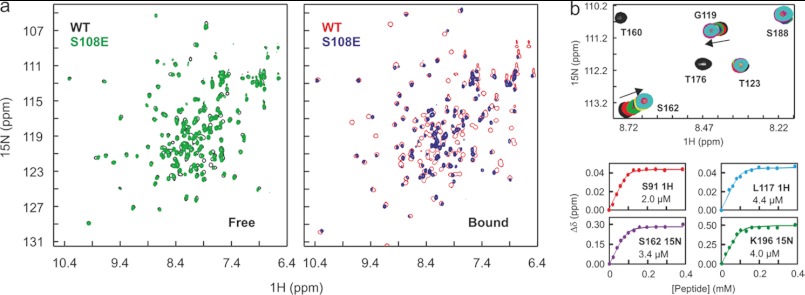
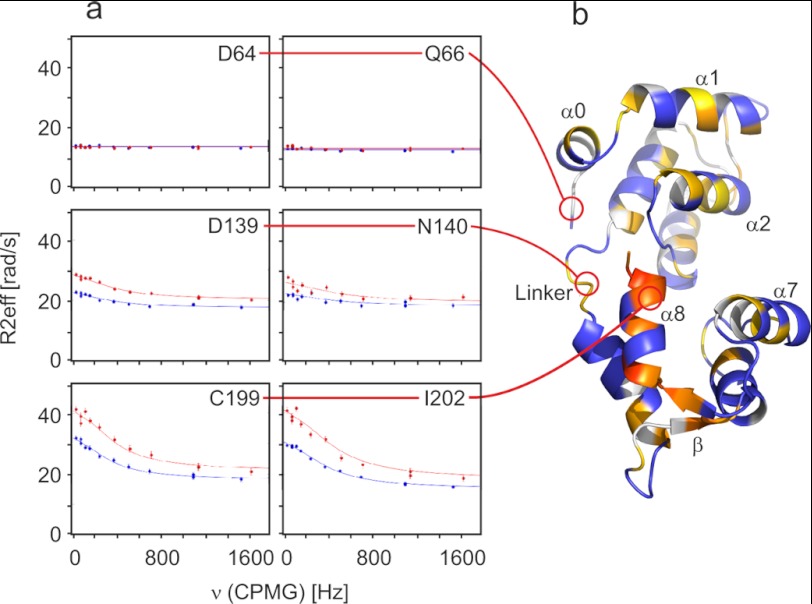
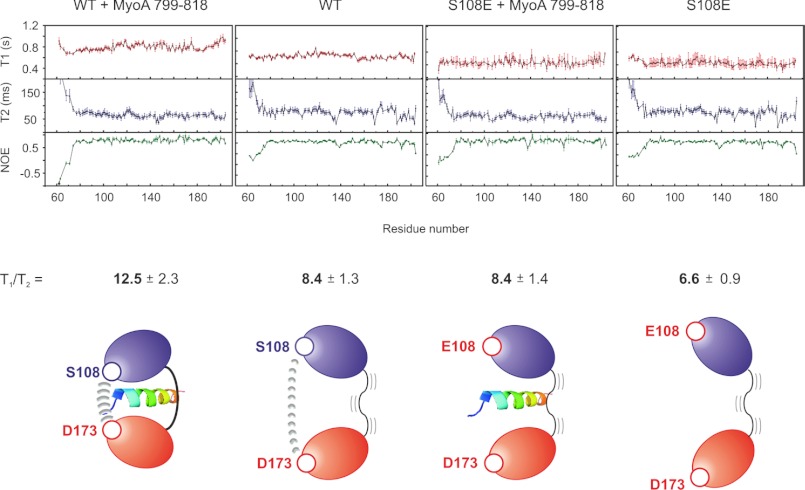
The interaction between the C-terminal tail of myosin A (MyoA) and its light chain, myosin A tail domain interacting protein (MTIP), is an essential feature of the conserved molecular machinery required for gliding motility and cell invasion by apicomplexan parasites. Recent data indicate that MTIP Ser-107 and/or Ser-108 are targeted for intracellular phosphorylation. Using an optimized MyoA tail peptide to reconstitute the complex, we show that this region of MTIP is an interaction hotspot using x-ray crystallography and NMR, and S107E and S108E mutants were generated to mimic the effect of phosphorylation. NMR relaxation experiments and other biophysical measurements indicate that the S108E mutation serves to break the tight clamp around the MyoA tail, whereas S107E has a smaller but measurable impact. These data are consistent with physical interactions observed between recombinant MTIP and native MyoA from Plasmodium falciparum lysates. Taken together these data support the notion that the conserved interactions between MTIP and MyoA may be specifically modulated by this post-translational modification.
Figures
Similar articles
-
The structure of the D3 domain of Plasmodium falciparum myosin tail interacting protein MTIP in complex with a nanobody.Mol Biochem Parasitol. 2013 Aug;190(2):87-91. doi: 10.1016/j.molbiopara.2013.06.003. Epub 2013 Jul 4. Mol Biochem Parasitol. 2013. PMID: 23831371
-
Myosin A tail domain interacting protein (MTIP) localizes to the inner membrane complex of Plasmodium sporozoites.J Cell Sci. 2003 Jan 1;116(Pt 1):39-49. doi: 10.1242/jcs.00194. J Cell Sci. 2003. PMID: 12456714
-
The MTIP-myosin A complex in blood stage malaria parasites.J Mol Biol. 2006 Feb 3;355(5):933-41. doi: 10.1016/j.jmb.2005.11.027. Epub 2005 Nov 28. J Mol Biol. 2006. PMID: 16337961
-
Structure of the MTIP-MyoA complex, a key component of the malaria parasite invasion motor.Proc Natl Acad Sci U S A. 2006 Mar 28;103(13):4852-7. doi: 10.1073/pnas.0510907103. Epub 2006 Mar 17. Proc Natl Acad Sci U S A. 2006. PMID: 16547135 Free PMC article.
-
Targeting a dynamic protein-protein interaction: fragment screening against the malaria myosin A motor complex.ChemMedChem. 2015 Jan;10(1):134-43. doi: 10.1002/cmdc.201402357. Epub 2014 Nov 3. ChemMedChem. 2015. PMID: 25367834 Free PMC article.
Cited by
-
Dissecting the molecular assembly of the Toxoplasma gondii MyoA motility complex.J Biol Chem. 2017 Nov 24;292(47):19469-19477. doi: 10.1074/jbc.M117.809632. Epub 2017 Sep 25. J Biol Chem. 2017. PMID: 28972141 Free PMC article.
-
HOPPI-NMR: Hot-Peptide-Based Screening Assay for Inhibitors of Protein-Protein Interactions by NMR.ACS Med Chem Lett. 2020 Feb 20;11(5):1047-1053. doi: 10.1021/acsmedchemlett.9b00620. eCollection 2020 May 14. ACS Med Chem Lett. 2020. PMID: 32435424 Free PMC article.
-
Full-length Plasmodium falciparum myosin A and essential light chain PfELC structures provide new anti-malarial targets.Elife. 2020 Oct 13;9:e60581. doi: 10.7554/eLife.60581. Elife. 2020. PMID: 33046215 Free PMC article.
-
Structural role of essential light chains in the apicomplexan glideosome.Commun Biol. 2020 Oct 13;3(1):568. doi: 10.1038/s42003-020-01283-8. Commun Biol. 2020. PMID: 33051581 Free PMC article.
-
Towards a molecular understanding of the apicomplexan actin motor: on a road to novel targets for malaria remedies?Acta Crystallogr F Struct Biol Commun. 2015 May;71(Pt 5):500-13. doi: 10.1107/S2053230X1500391X. Epub 2015 Apr 16. Acta Crystallogr F Struct Biol Commun. 2015. PMID: 25945702 Free PMC article. Review.
References
-
- Baum J., Papenfuss A. T., Baum B., Speed T. P., Cowman A. F. (2006) Regulation of apicomplexan actin-based motility. Nat. Rev. Microbiol. 4, 621–628 - PubMed
-
- Farrow R. E., Green J., Katsimitsoulia Z., Taylor W. R., Holder A. A., Molloy J. E. (2011) The mechanism of erythrocyte invasion by the malarial parasite, Plasmodium falciparum. Semin. Cell. Dev. Biol. 22, 953–960 - PubMed
-
- Frénal K., Soldati-Favre D. (2009) Role of the parasite and host cytoskeleton in apicomplexa parasitism. Cell Host Microbe 5, 602–611 - PubMed
-
- Kappe S. H., Buscaglia C. A., Bergman L. W., Coppens I., Nussenzweig V. (2004) Apicomplexan gliding motility and host cell invasion. Overhauling the motor model. Trends Parasitol. 20, 13–16 - PubMed
-
- Bergman L. W., Kaiser K., Fujioka H., Coppens I., Daly T. M., Fox S., Matuschewski K., Nussenzweig V., Kappe S. H. (2003) Myosin A tail domain interacting protein (MTIP) localizes to the inner membrane complex of Plasmodium sporozoites. J. Cell Sci. 116, 39–49 - PubMed
Publication types
MeSH terms
Substances
Associated data
- Actions
Grants and funding
LinkOut - more resources
Full Text Sources
Other Literature Sources
