. 2013 Jan;62(1):223-33.
doi: 10.2337/db12-0177. Epub 2012 Aug 29.

Loss of ACE2 exaggerates high-calorie diet-induced insulin resistance by reduction of GLUT4 in mice

Affiliations

Loss of ACE2 exaggerates high-calorie diet-induced insulin resistance by reduction of GLUT4 in mice

Masao Takeda et al. Diabetes. 2013 Jan.

Abstract

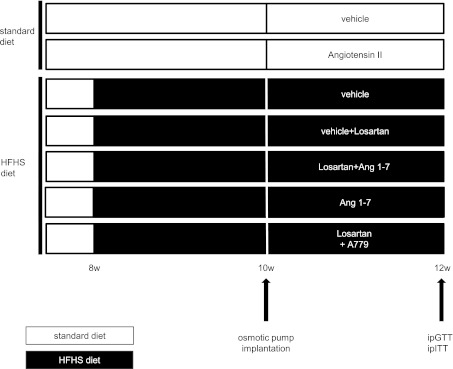
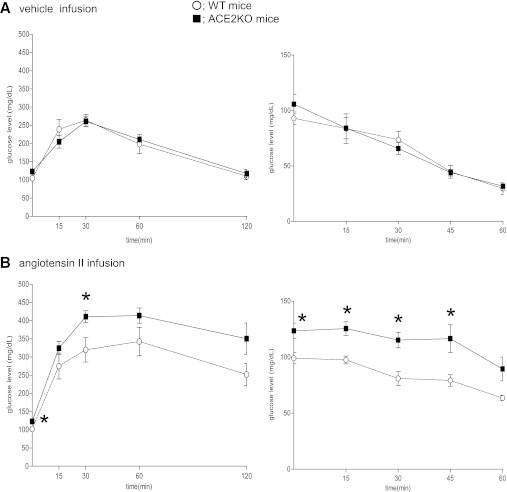
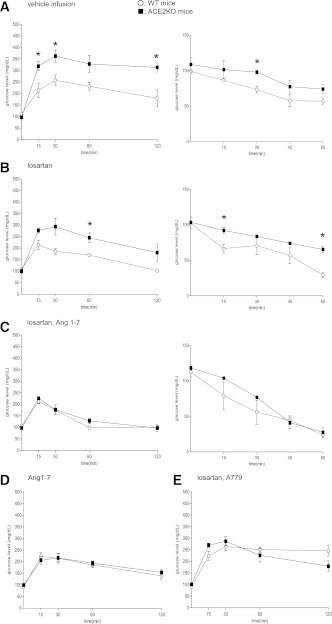
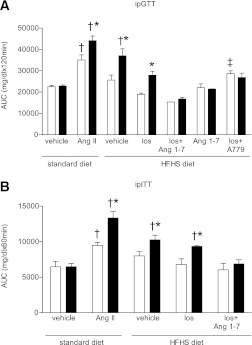
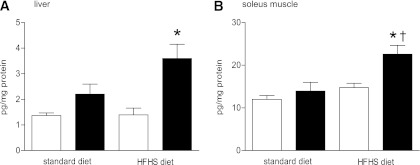
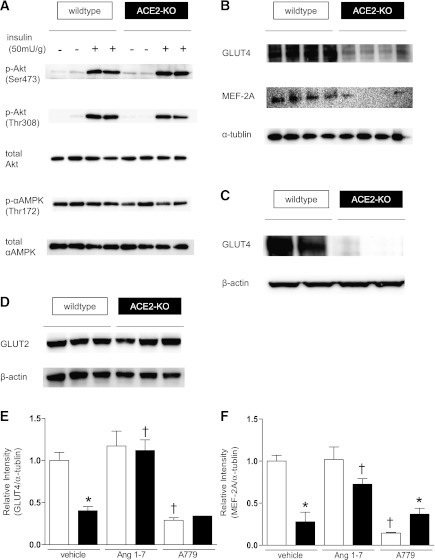
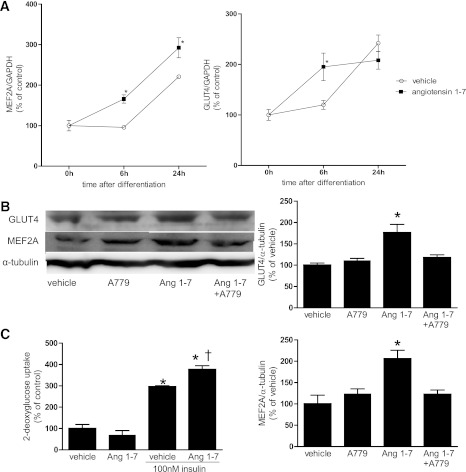
ACE type 2 (ACE2) functions as a negative regulator of the renin-angiotensin system by cleaving angiotensin II (AII) into angiotensin 1-7 (A1-7). This study assessed the role of endogenous ACE2 in maintaining insulin sensitivity. Twelve-week-old male ACE2 knockout (ACE2KO) mice had normal insulin sensitivities when fed a standard diet. AII infusion or a high-fat, high-sucrose (HFHS) diet impaired glucose tolerance and insulin sensitivity more severely in ACE2KO mice than in their wild-type (WT) littermates. The strain difference in glucose tolerance was not eliminated by an AII receptor type 1 (AT1) blocker but was eradicated by A1-7 or an AT1 blocker combined with the A1-7 inhibitor (A779). The expression of GLUT4 and a transcriptional factor, myocyte enhancer factor (MEF) 2A, was dramatically reduced in the skeletal muscles of the standard diet-fed ACE2KO mice. The expression of GLUT4 and MEF2A was increased by A1-7 in ACE2KO mice and decreased by A779 in WT mice. A1-7 enhanced upregulation of MEF2A and GLUT4 during differentiation of myoblast cells. In conclusion, ACE2 protects against high-calorie diet-induced insulin resistance in mice. This mechanism may involve the transcriptional regulation of GLUT4 via an A1-7-dependent pathway.


Figures

FIG. 1.
FIG. 1.
Experimental protocol. ACE2KO mice and WT mice were divided into seven groups. Vehicle (0.9% saline), angiotensin II (100 ng/kg/min), angiotensin (Ang) 1–7 (100 ng/kg/min), and A779 (300 ng/kg/min) were administered via osmotic pumps. Losartan was administered at 3 mg/kg/day via drinking water. HFHS diet–fed mice that received angiotensin 1–7 alone and HFHS diet–fed mice that received A779, and losartan only underwent IPGTT.
FIG. 2.
FIG. 2.
Profiles of IPGTT and IPITT in standard diet–fed mice. IPGTT (left panel) and IPITT (right panel) testing of overnight-fasted, standard diet–fed mice that received 2-week infusions of vehicle (0.9% saline) (A) or angiotensin II (100 ng/kg/min) (B). Data are presented as the mean ± SEM (mg/dL), n = 4 in each group. *P < 0.05 vs. WT mice by Student t test.
FIG. 3.
FIG. 3.
Profiles of IPGTT and IPITT in HFHS diet–fed mice. IPGTT (left panel) and IPITT (right panel) testing of overnight-fasted, HFHS diet–fed mice with vehicle (0.9% saline) infusion (A) and vehicle infusion and 3 mg/kg/day losartan (B) or angiotensin 1–7 infusion (100 ng/kg/min) and losartan (C). IPGTT of overnight-fasted, HFHS diet–fed mice with angiotensin 1–7 infusion (D) or A779 infusion (300 ng/kg/min) and losartan (E). Data are presented as the mean ± SEM (mg/dL), n = 4 in each group. *P < 0.05 vs. WT mice by Student t test.
FIG. 4.
FIG. 4.
Summary of the AUC of IPGTT and IPITT. AUCs of IPGTT test (A) and IPITT test (B) for WT mice (□) and ACE2KO mice (■). Data are presented as the mean ± SEM (mg/dL), n = 4 in each group. *P < 0.05 vs. WT mice that received the same treatment by Student t test. †P < 0.05 vs. genotype-matched, standard diet–fed mice with vehicle infusion by a one-way ANOVA. ‡P < 0.05 vs. HFHS diet–fed WT mice that received losartan alone by Student t test. Ang II, angiotensin II; los, losartan; Ang 1–7, angiotensin 1–7.
FIG. 5.
FIG. 5.
Tissue angiotensin II concentrations. Angiotensin II concentration in liver (A) and soleus muscle (B) of WT mice (□) and ACE2KO mice (■). Data are presented as the mean ± SEM (mg/dL), n = 4–5 in each group. *P < 0.05 vs. WT mice with the same treatment by Student t test. †P < 0.05 vs. standard diet–fed ACE2KO mice by Student t test.
FIG. 6.
FIG. 6.
Western blot analysis of soleus muscle, adipose tissue, and liver. A: Phosphorylation (p) of Akt at Ser473, Thr308, and of α-AMPK at Thr172, with or without intraperitoneal injection of insulin for 5 min in soleus muscle of standard diet–fed mice. B: Total GLUT4 and MEF2A protein in soleus muscle of standard diet–fed mice (α-tubulin was used for internal control). C: GLUT4 protein in adipose tissue of standard diet–fed mice. D: GLUT2 protein in liver of standard diet–fed mice. Change in protein expression of MEF2A and GLUT4 in soleus muscle in standard diet–fed mice with administration of vehicle, angiotensin (Ang) 1–7, and Ang 1–7 inhibitor vehicle (0.9% saline), Ang 1–7 (100 ng/kg/min), and A779 (300 ng/kg/min) were administered via subcutaneously implanted osmotic pumps to 10-week-old, standard diet–fed mice. Soleus muscles were isolated at 12 weeks of age. Densitometric analyses were performed to calculate the relative intensities of GLUT4/α-tubulin (E) and MEF2A/α-tubulin (F) in WT (□) and ACE2KO mice (■). Data are presented as the mean ± SEM, n = 3–4 in each group. *P < 0.05 vs. WT mice that received the same treatment by Student t test. †P < 0.05 vs. genotype-matched, standard diet–fed mice with vehicle infusion by one-way ANOVA.
FIG. 7.
FIG. 7.
In vitro assay using C2C12 cells. A: Real time PCR analysis of MEF2A and GLUT4 gene expression during differentiation of C2C12 cells from myoblast to myotubes with or without treatment of 10−8 mol/L angiotensin (Ang) 1–7; n = 4 in each group. *P < 0.05 vs. vehicle treatment control by a Student t test. B: Immunoblot analysis of MEF2A and GLUT4 protein levels 24 h after induction of differentiation of C2C12 cells with vehicle, 10−5 mol/L A779, 10−8 mol/L Ang 1–7, or Ang 1–7 with A779. Representative blot (left panel) and the relative intensities of GLUT4/α-tubulin and MEF2A/α-tubulin (right panel) are shown; n = 3 in each group. *P < 0.05 vs. vehicle by one-way ANOVA. C: Glucose uptake of C2C12 cells 24 h after induction of differentiation with or without treatment of 10−8 mol/L Ang 1–7; n = 3 in each group. *P < 0.05 vs. the same treatment without insulin by one-way ANOVA. †P < 0.05 vs. vehicle treatment with insulin by one-way ANOVA.

Comment in

References

    1. Abuissa H, Jones PG, Marso SP, O’Keefe JH., Jr Angiotensin-converting enzyme inhibitors or angiotensin receptor blockers for prevention of type 2 diabetes: a meta-analysis of randomized clinical trials. J Am Coll Cardiol 2005;46:821–826 - PubMed
    1. Clarke NE, Turner AJ. Angiotensin-converting enzyme 2: the first decade. Int J Hypertens 2012;2012:307315. - PMC - PubMed
    1. Tipnis SR, Hooper NM, Hyde R, Karran E, Christie G, Turner AJ. A human homolog of angiotensin-converting enzyme. Cloning and functional expression as a captopril-insensitive carboxypeptidase. J Biol Chem 2000;275:33238–33243 - PubMed
    1. Yamamoto K, Ohishi M, Katsuya T, et al. Deletion of angiotensin-converting enzyme 2 accelerates pressure overload-induced cardiac dysfunction by increasing local angiotensin II. Hypertension 2006;47:718–726 - PubMed
    1. Shiota A, Yamamoto K, Ohishi M, et al. Loss of ACE2 accelerates time-dependent glomerular and tubulointerstitial damage in streptozotocin-induced diabetic mice. Hypertens Res 2010;33:298–307 - PubMed

MeSH terms