. 2013 Jan;62(1):65-73.
doi: 10.2337/db11-1727. Epub 2012 Aug 28.

Increased hepatic glucose production in fetal sheep with intrauterine growth restriction is not suppressed by insulin

Affiliations

Increased hepatic glucose production in fetal sheep with intrauterine growth restriction is not suppressed by insulin

Stephanie R Thorn et al. Diabetes. 2013 Jan.

Abstract

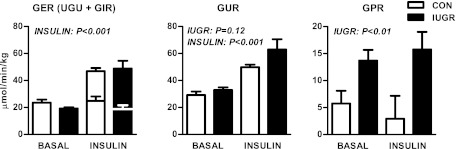
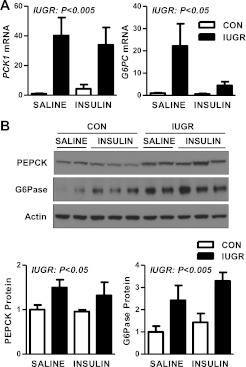
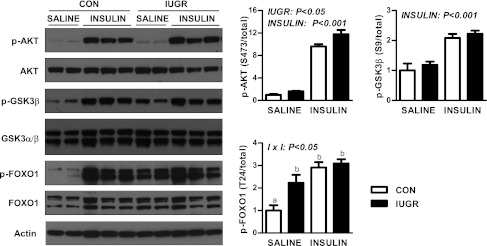
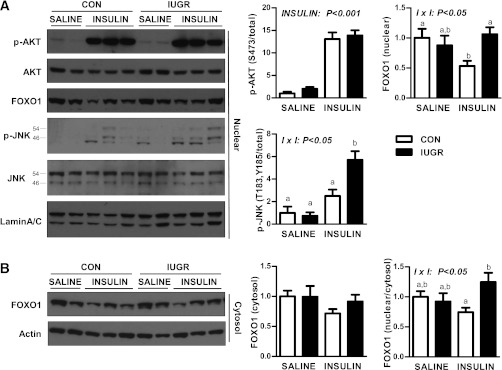
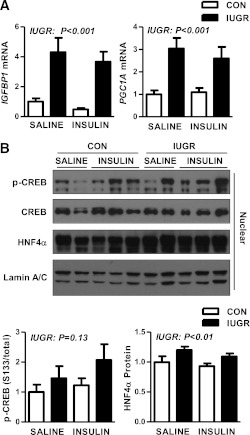
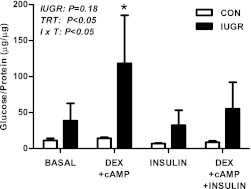
Intrauterine growth restriction (IUGR) increases the risk for metabolic disease and diabetes, although the developmental origins of this remain unclear. We measured glucose metabolism during basal and insulin clamp periods in a fetal sheep model of placental insufficiency and IUGR. Compared with control fetuses (CON), fetuses with IUGR had increased basal glucose production rates and hepatic PEPCK and glucose-6-phosphatase expression, which were not suppressed by insulin. In contrast, insulin significantly increased peripheral glucose utilization rates in CON and IUGR fetuses. Insulin robustly activated AKT, GSK3β, and forkhead box class O (FOXO)1 in CON and IUGR fetal livers. IUGR livers, however, had increased basal FOXO1 phosphorylation, nuclear FOXO1 expression, and Jun NH(2)-terminal kinase activation during hyperinsulinemia. Expression of peroxisome proliferator-activated receptor γ coactivator 1α and hepatocyte nuclear factor-4α were increased in IUGR livers during basal and insulin periods. Cortisol and norepinephrine concentrations were positively correlated with glucose production rates. Isolated IUGR hepatocytes maintained increased glucose production in culture. In summary, fetal sheep with IUGR have increased hepatic glucose production, which is not suppressed by insulin despite insulin sensitivity for peripheral glucose utilization. These data are consistent with a novel mechanism involving persistent transcriptional activation in the liver that seems to be unique in the fetus with IUGR.


Figures

FIG. 1.
FIG. 1.
Glucose metabolism flux rates measured in late gestation CON and growth-restricted (IUGR) fetal sheep during basal and hyperinsulinemic clamp (insulin) periods. Total fetal GER represents the sum of UGU (lower bars) and GIR (upper bars). GUR was measured with glucose tracer, and GPR represents the difference between GUR and GER. Means ± SE are shown for CON (n = 6; white bars) and IUGR (n = 8 or 9; black bars). Significant effects from two-way ANOVA are indicated.
FIG. 2.
FIG. 2.
Fetal glucose metabolism rates and plasma hormones. A: The relationship between GUR (left) and GPR (right) and insulin infusion rate during the clamp in CON (n = 6) and growth-restricted (IUGR) (n = 8) fetuses. B: The relationship between GPR with plasma cortisol (log-transformed) (left) and norepinephrine (log-transformed) concentrations (right) in CON and IUGR fetuses during basal and hyperinsulinemic clamp (insulin) periods (n = 28).
FIG. 3.
FIG. 3.
The effect of growth restriction (IUGR) and hyperinsulinemia (insulin) on the expression of gluconeogenic genes and proteins in the fetal liver. Liver samples were collected from CON and IUGR fetuses after a saline infusion (saline) or hyperinsulinemic clamp (insulin). A: RNA was analyzed for expression of PCK1 and G6PC. Means ± SE are shown for each group in saline (CON, n = 5; IUGR, n = 9) and insulin (CON, n = 11; IUGR, n = 13). B: Protein expression of PEPCK, G6Pase, and β-actin was measured by Western blotting in whole-cell tissue lysates. Representative images and quantifications are shown for saline (CON, n = 4; IUGR, n = 4) and insulin (CON, n = 6; IUGR, n = 6). Significant effects from two-way ANOVA are indicated.
FIG. 4.
FIG. 4.
The effect of growth restriction (IUGR) and hyperinsulinemia (insulin) on the activation of AKT, GSK3β, and FOXO1 in the fetal liver. Protein expression of p-AKT (S473), total AKT, p-GSK3β (S9), total GSK3β, p-FOXO1 (T24), total FOXO1, and actin was measured by Western blotting in whole-cell tissue lysates. Representative images are shown. Results were quantified and means ± SE are shown for saline (CON, n = 4; IUGR, n = 4) and insulin (CON, n = 6; IUGR, n = 6). Significant effects from two-way ANOVA are indicated.
FIG. 5.
FIG. 5.
The effect of growth restriction (IUGR) and hyperinsulinemia (insulin) on nuclear AKT, FOXO1, and JNK in the fetal liver. A: Nuclear protein expression of p-AKT (S473), total AKT, total FOXO1, p-JNK (p54 and p46 at T183/Y185), total JNK (p54 and p46), and lamin A/C measured by Western blotting. B: Cytosolic protein expression of FOXO1 and β-actin. Representative images and quantification of results and ratio of nuclear to cytosolic FOXO1 protein expression are shown. Means ± SE are shown for saline (CON, n = 4; IUGR, n = 4) and insulin (CON, n = 6; IUGR, n = 6). Significant effects from two-way ANOVA are indicated. Bars with different letters are significant differences when interaction (I × I) is significant.
FIG. 6.
FIG. 6.
The effect of growth restriction (IUGR) and hyperinsulinemia (insulin) on expression nuclear target genes and regulators in the fetal liver. Liver samples were collected from CON and IUGR fetuses after a saline infusion (saline) or hyperinsulinemic clamp (insulin). A: RNA was analyzed for expression of IGFBP1 and PGC1A. Means ± SE are shown for each group in saline (CON, n = 5; IUGR, n = 9) and insulin (CON, n = 11; IUGR, n = 13). B: Nuclear protein expression of p-CREB (S133), total CREB, and total HNF4α was measured by Western blotting. Representative images are shown. Results were quantified and means ± SE are shown for saline (CON, n = 4; IUGR, n = 4) and insulin (CON, n = 6; IUGR, n = 6). Significant effects from two-way ANOVA are indicated.
FIG. 7.
FIG. 7.
The effect of growth restriction (IUGR) on glucose production in isolated primary fetal hepatocytes. Hepatocytes were isolated from CON and IUGR fetal livers. Glucose production was measured after 24 h of treatment with 500 nmol/L dexamethasone (DEX), 100 μmol/L cAMP, or 100 nmol/L insulin, as indicated. Results are expressed as glucose produced (μg) per amount of protein per well (μg). Means ± SE are shown (CON cell isolations, n = 4; IUGR cell isolations, n = 4). Significant effects from two-way ANOVA are indicated. *P < 0.05 compared with all other group × treatment (I × T) comparisons.

References

    1. Symonds ME, Sebert SP, Hyatt MA, Budge H. Nutritional programming of the metabolic syndrome. Nat Rev Endocrinol 2009;5:604–610 - PubMed
    1. Thorn SR, Rozance PJ, Brown LD, Hay WW., Jr The intrauterine growth restriction phenotype: fetal adaptations and potential implications for later life insulin resistance and diabetes. Semin Reprod Med 2011;29:225–236 - PMC - PubMed
    1. Martin-Gronert MS, Ozanne SE. Experimental IUGR and later diabetes. J Intern Med 2007;261:437–452 - PubMed
    1. Limesand SW, Rozance PJ, Zerbe GO, Hutton JC, Hay WW., Jr Attenuated insulin release and storage in fetal sheep pancreatic islets with intrauterine growth restriction. Endocrinology 2006;147:1488–1497 - PubMed
    1. Park JH, Stoffers DA, Nicholls RD, Simmons RA. Development of type 2 diabetes following intrauterine growth retardation in rats is associated with progressive epigenetic silencing of Pdx1. J Clin Invest 2008;118:2316–2324 - PMC - PubMed

Publication types