. 2013 Jan;62(1):170-82.
doi: 10.2337/db11-1464. Epub 2012 Aug 28.

Bcl-2 and Bcl-xL suppress glucose signaling in pancreatic β-cells

Affiliations

Bcl-2 and Bcl-xL suppress glucose signaling in pancreatic β-cells

Dan S Luciani et al. Diabetes. 2013 Jan.

Abstract

B-cell lymphoma 2 (Bcl-2) family proteins are established regulators of cell survival, but their involvement in the normal function of primary cells has only recently begun to receive attention. In this study, we demonstrate that chemical and genetic loss-of-function of antiapoptotic Bcl-2 and Bcl-x(L) significantly augments glucose-dependent metabolic and Ca(2+) signals in primary pancreatic β-cells. Antagonism of Bcl-2/Bcl-x(L) by two distinct small-molecule compounds rapidly hyperpolarized β-cell mitochondria, increased cytosolic Ca(2+), and stimulated insulin release via the ATP-dependent pathway in β-cell under substimulatory glucose conditions. Experiments with single and double Bax-Bak knockout β-cells established that this occurred independently of these proapoptotic binding partners. Pancreatic β-cells from Bcl-2(-/-) mice responded to glucose with significantly increased NAD(P)H levels and cytosolic Ca(2+) signals, as well as significantly augmented insulin secretion. Inducible deletion of Bcl-x(L) in adult mouse β-cells also increased glucose-stimulated NAD(P)H and Ca(2+) responses and resulted in an improvement of in vivo glucose tolerance in the conditional Bcl-x(L) knockout animals. Our work suggests that prosurvival Bcl proteins normally dampen the β-cell response to glucose and thus reveals these core apoptosis proteins as integrators of cell death and physiology in pancreatic β-cells.


Figures

FIG. 1.
FIG. 1.
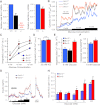
Small-molecule inhibition of Bcl-2/Bcl-xL rapidly displaces Bad and eventually induces mitochondrial apoptosis. A: Top: Western blot illustrating the loss of Bcl-xL coimmunoprecipitation with Bad in MIN6 β-cells treated with C6. Bottom: Densitometric quantification of the ratio of Bcl-xL to Bad protein in Bad immunoprecipitates after various durations of C6 exposure. Data (mean ± SEM) are normalized to control (n = 3–5; *P < 0.05 vs. time 0). B: Bcl-xL and Bad protein levels in MIN6 β-cells treated with 80 μmol/L C6 (n = 3; *P < 0.05 vs. time 0). C and D: PI incorporation in mouse islet cells and MIN6 β-cells during incubation with C6 (n = 3). E: Relative cell death (PI+ cells) in human islet cells treated with Bcl-2/Bcl-xL antagonists (n = 3 donor preparations). F: Western blots for Bax and cytochrome c (Cyto c) in mitochondrial and cytosolic fractions from MIN6 β-cells treated with 40 μmol/L C6 for 4 h (n = 3). G: Top: Caspase-3 activation (loss of MiCy-mKO FRET) imaged in four individual MIN6 β-cells during continued Bcl-2/Bcl-xL inhibition. Bottom: C6 (20 μmol/L) activated caspase-3 at an average time of 2.9 ± 0.3 h (n = 12 cells from two independent cultures). Staurosporine (STS; 10 μmol/L) activated caspase-3 after 1.65 ± 0.12 h (n = 10 cells from two independent cultures). H: Flow cytometric detection of mitochondrial membrane potential in MIN6 β-cells treated with 20 μmol/L C6, 20 μmol/L YC137, and 30 mmol/L glucose (30G). Reduction of TMRE intensity indicates a loss of ΔΨm (n = 3 cultures). (A high-quality color representation of this figure is available in the online issue.)
FIG. 2.
FIG. 2.
Bcl-2/Bcl-xL inhibition triggers cytosolic Ca2+ fluctuations. A and B: Cytosolic Ca2+ responses of groups of mouse islet cells exposed to Bcl-2/Bcl-xL inhibitors C6 and YC137 in the presence of 3 mmol/L glucose. C and D: Representative cytosolic Ca2+ responses to C6 in human islet cells (n = 66 cells from three islet preparations) and MIN6 β-cells (n = 34 cells). E: Quantification of the percentage of baseline quiescent mouse islet cells that responded within 30 min to various doses of C6 in the presence of either 3 or 0 mmol/L glucose (n = 3–6 for each condition; *P < 0.05 vs. control in 3 mmol/L glucose, #P < 0.05 vs. 40 μmol/L C6 in 3 mmol/L glucose; n.s., not significant). F: Average cytosolic Ca2+ responses of intact pancreatic islets stimulated with 15 mmol/L glucose in the presence or absence of 80 μmol/L C6. Shaded hanging bars represent SEM (n = 12, n = 10). (A high-quality color representation of this figure is available in the online issue.)
FIG. 3.
FIG. 3.
Differential subcellular distribution of Bcl-2 and Bcl-xL in β-cells. A and B: Representative images of MIN6 cells expressing GFP-tagged Bcl-2 and YFP-tagged Bcl-xL and loaded with 100 nmol/L MitoTracker Red. C: MIN6 cell coexpressing Bcl-xL:YFP and ER-targeted monomeric red fluorescent protein (mRFP). D: Pearson correlation coefficient (coeff.) quantifying colocalization of Bcl-xL:YFP with mitochondrial dsRed (n = 6) or ER mRFP (n = 5) and Bcl-2:GFP with ER mRFP (n = 5) in MIN6 β-cells (*P < 0.05, **P < 0.001). E: Western blots for endogenous Bcl-2 and Bcl-xL in fractions of MIN6 β-cells (n = 3). Cytochrome c oxidase (Cox-IV) indicates the mitochondrial fraction. (A high-quality digital representation of this figure is available in the online issue.)
FIG. 4.
FIG. 4.
Bcl-2/Bcl-xL antagonism stimulates β-cell mitochondrial metabolism, KATP-dependent Ca2+ entry, and insulin secretion. A: Representative recording of ER Ca2+ changes in MIN6 β-cells exposed to C6 and carbachol (Cch) (n = 6 cells). Inset: MIN6 cell expressing the ER-targeted D1ER Ca2+ sensor. B: Lack of C6-induced Ca2+ influx in the absence of extracellular Ca2+. The basally active cell illustrates the rapid loss of Ca2+ entry upon Ca2+ removal. C: Nifedipine blocks ongoing C6-induced Ca2+ influx (n = 14 cells). D: Quantification of nifedipine, diazoxide (Dz), and CCCP-mediated suppression of cytosolic Ca2+ responses in mouse islet cells exposed to C6 or YC137 (n = 3). E: Insulin secretion from dispersed islet-cells treated with C6, diazoxide, and/or tolbutamide (Tolb) (n = 5). *P < 0.05 vs. 3 mmol/L glucose control. F: Percentage of PI-positive mouse islet cells following culture with C6 with or without the presence of nifedipine or Dz (n = 3). G: Reversible inhibition of C6-induced Ca2+ signaling in mouse islet cells by sodium azide (NaN3). H and I: Relative changes in ΔΨm of primary mouse β-cells exposed to stimulatory glucose and the Bcl-2 antagonist C6. In panel H, glucose was added prior to C6. The black line is representative of 38 cells exposed to 80 µmol/L, and the superimposed red line is representative of 15 cells responding to a shorter stimulation with 20 μmol/L C6. Panel I illustrates the addition of glucose during the C6-induced response (representative of 17 cells). Loss of rhodamine 123 fluorescence indicates mitochondrial hyperpolarization. J: MIN6 β-cell expressing the mitochondrial FRET-based Ca2+ sensor mt4D3cpv and examples of mitochondrial Ca2+ fluctuations induced by glucose or Bcl-2/Bcl-xL inhibition (n = 29 cells at 40 μmol/L C6; n = 34 cells at 80 μmol/L C6). K: Change in the cellular ATP-to-ADP ratio of MIN6 β-cells following 30 min culture in stimulatory 20 mmol/L glucose (20G) or in 3 mmol/L glucose with 60 μmol/L C6, relative to 3 mmol/L glucose alone. The depletion seen with CCCP reflects the metabolic pool of ATP (n = 3 cultures; *P < 0.05, **P < 0.001 vs. 3 mmol/L glucose; n.s., not significant). Data are mean ± SEM. Basal glucose is 3 mmol/L in all experiments. (A high-quality color representation of this figure is available in the online issue.)
FIG. 5.
FIG. 5.
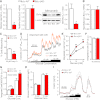
Loss of Bcl-2 enhances β-cell glucose responses. A: Quantitative PCR (qPCR) quantification of Bcl-2 and Bcl-xL mRNA levels in islets from Bcl-2+/− and Bcl-2−/− mice relative to Bcl-2+/+ littermates (n = 3 mice of each genotype). All data are mean ± SEM. B: Average cytosolic Ca2+ levels of dispersed islet cells from littermate Bcl-2+/+, Bcl-2+/−, and Bcl-2−/− mice. Shaded hanging bars represent SEM. C: Incremental area under the curve of Ca2+ responses (n = 98 Bcl-2+/+ cells, n = 144 Bcl-2+/− cells, and n = 147 Bcl-2−/− cells from three mice of each genotype; *P < 0.001 Bcl-2−/− vs. Bcl-2+/+, **P < 0.01 Bcl-2−/− vs. Bcl-2+/−, and #P < 0.05 Bcl-2+/− vs. Bcl+/+). D: Integrated cytosolic Ca2+ responses of Bcl-2−/− and Bcl-2+/+ β-cells depolarized with 30 mmol/L KCl (n = 87 Bcl-2+/+ cells and 130 Bcl-2−/− cells from three mice of each genotype). n.s., not significant. E and F: Integrated Ca2+ and NAD(P)H autofluorescence increases of intact islets, normalized to Bcl-2+/+ control (panel E: n = 16 Bcl-2+/+ islets; n = 20 Bcl-2+/− islets; n = 21 Bcl-2−/− islets; and panel F: n = 16 Bcl-2+/+ islets; n = 17 Bcl-2−/− islets; three mice of each genotype; *P < 0.05, **P < 0.01 vs. Bcl-2+/+). G: Insulin secretion profiles of perifused islets from 5–7-week-old Bcl-2+/+ and Bcl-2−/− mice. H: Quantified area under the curve of insulin secretion profiles in panel G (n = 5; *P < 0.05 vs. Bcl-2+/+). a.u., arbitrary units. (A high-quality color representation of this figure is available in the online issue.)
FIG. 6.
FIG. 6.
Inducible deletion of Bcl-xL enhances β-cell glucose signaling. A: Quantification of Bcl-xL and Bcl-2 mRNA levels by quantitative PCR (qPCR) (n = 3) and Bcl-xL protein by Western blot (n = 6) in islets from tamoxifen-injected Bcl-xflox/flox:Pdx1-CreER (Bcl-x βKO) mice relative to islets from tamoxifen-injected littermate Bcl-xflox/flox (Bcl-x WT) mice (data are mean ± SEM; *P < 0.05). B: qPCR quantification of Bcl-xL mRNA in hypothalamus from Bcl-xL WT and KO mice (n = 3). C: Percentage of Bcl-x WT and βKO islet cells responding to small-molecule Bcl inhibition (n = 5 mice of each genotype; **P < 0.001 vs. Bcl-x WT). D: Average cytosolic Ca2+ responses of Bcl-x βKO and WT β-cells stimulated with increasing glucose concentrations (Conc.). Shaded hanging bars represent SEM. E: Incremental area under the curve of Ca2+ responses. F: Integrated Ca2+ responses of Bcl-x KO and Bcl-x WT β-cells depolarized with 30 mmol/L KCl (n = 66 Bcl-x WT cells; n = 73 Bcl-x KO cells; three mice per genotype; **P < 0.001). G: Integrated NAD(P)H increases of intact islets following glucose stimulation (n = 11 islets, two mice of each genotype; *P < 0.05). H: Glucose oxidation rates in cultures of dispersed Bcl-xL WT and KO islet cells (n = 4). I: Insulin secretion from perifused Bcl-x WT and KO islets (n = 5). a.u., arbitrary units. (A high-quality color representation of this figure is available in the online issue.)
FIG. 7.
FIG. 7.
Improved glucose tolerance in Bcl-x βKO mice. A: In vivo insulin secretion following intraperitoneal injection of 2 g/kg glucose in 10–12-week-old Bcl-x WT and βKO littermate mice (n = 5). B and C: Intraperitoneal glucose tolerance tests of Bcl-x βKO and WT mice using 2 and 0.5 g/kg glucose doses (n = 7 and n = 8, respectively; *P < 0.05). D: Area under the curve analysis of glucose profiles in panels B and C. E: Insulin tolerance test of Bcl-x WT and βKO mice (n = 5). IPGTT, intraperitoneal glucose tolerance test; mM, mmol/L. (A high-quality color representation of this figure is available in the online issue.)
FIG. 8.
FIG. 8.
Effect of Bcl antagonism in Bax, Bak, and Bcl-xL–deficient islet cells. A: Percentage of islet cells responding to Bcl antagonism in preparations from Bax−/− (left), Bak−/− (right), and their wild-type control mice (n = 3 mice). Data are mean ± SEM. Basal glucose was 3 mmol/L in all experiments. B: Western blot demonstrating global Bak deficiency and islet specific Bax knockout in tamoxifen-injected Bak−/−:Baxflox/flox:Pdx1-CreER (Bax-Bak βDKO) mice relative to tamoxifen-injected Bak−/−:Baxflox/flox and C57BL6/J (C57) mice. C: Bax protein levels were reduced by 85% in Bax-Bak βDKO islets (n = 6; **P < 0.001 vs. Bak−/−:Baxflox/flox). D: Comparable Bcl inhibitor-induced Ca2+ responses in groups of Bak−/−Baxflox/flox and Bax-Bak βDKO islet cells. E: Percentage of Bak-Bax βDKO and Bak−/−:Baxflox/flox islet-cells responding to Bcl inhibition (n = 3 mice of each genotype). (A high-quality color representation of this figure is available in the online issue.)

Comment in

Similar articles

Cited by

References

    1. Petros AM, Olejniczak ET, Fesik SW. Structural biology of the Bcl-2 family of proteins. Biochim Biophys Acta 2004;1644:83–94 - PubMed
    1. Youle RJ, Strasser A. The BCL-2 protein family: opposing activities that mediate cell death. Nat Rev Mol Cell Biol 2008;9:47–59 - PubMed
    1. Danial NN, Walensky LD, Zhang CY, et al. Dual role of proapoptotic BAD in insulin secretion and beta cell survival. Nat Med 2008;14:144–153 - PMC - PubMed
    1. Emamaullee JA, Shapiro AM. Interventional strategies to prevent beta-cell apoptosis in islet transplantation. Diabetes 2006;55:1907–1914 - PubMed
    1. Carrington EM, McKenzie MD, Jansen E, et al. Islet beta-cells deficient in Bcl-xL develop but are abnormally sensitive to apoptotic stimuli. Diabetes 2009;58:2316–2323 - PMC - PubMed

Publication types