. 2012 Nov;61(11):2753-62.
doi: 10.2337/db11-1556. Epub 2012 Aug 28.

Direct control of brown adipose tissue thermogenesis by central nervous system glucagon-like peptide-1 receptor signaling

Affiliations

Direct control of brown adipose tissue thermogenesis by central nervous system glucagon-like peptide-1 receptor signaling

Sarah H Lockie et al. Diabetes. 2012 Nov.

Abstract

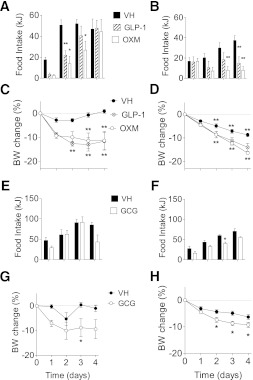
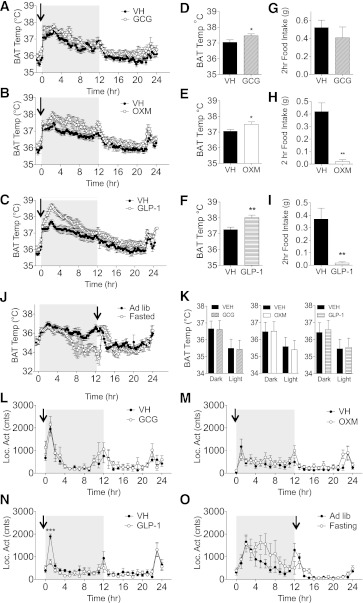
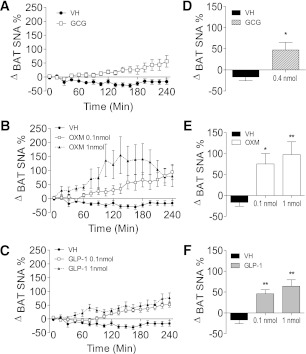
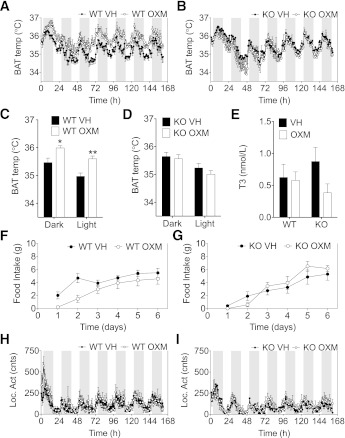
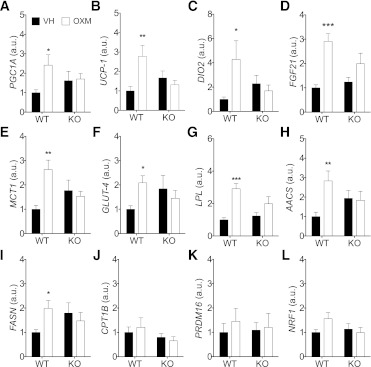
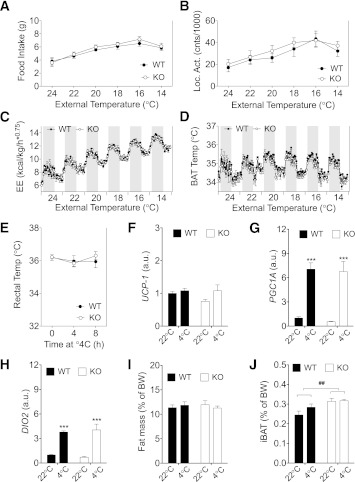
We studied interscapular brown adipose tissue (iBAT) activity in wild-type (WT) and glucagon-like peptide 1 receptor (GLP-1R)-deficient mice after the administration of the proglucagon-derived peptides (PGDPs) glucagon-like peptide (GLP-1), glucagon (GCG), and oxyntomodulin (OXM) directly into the brain. Intracerebroventricular injection of PGDPs reduces body weight and increases iBAT thermogenesis. This was independent of changes in feeding and insulin responsiveness but correlated with increased activity of sympathetic fibers innervating brown adipose tissue (BAT). Despite being a GCG receptor agonist, OXM requires GLP-1R activation to induce iBAT thermogenesis. The increase in thermogenesis in WT mice correlates with increased expression of genes upregulated by adrenergic signaling and required for iBAT thermogenesis, including PGC1a and UCP-1. In spite of the increase in iBAT thermogenesis induced by GLP-1R activation in WT mice, Glp1r(-/-) mice exhibit a normal response to cold exposure, demonstrating that endogenous GLP-1R signaling is not essential for appropriate thermogenic response after cold exposure. Our data suggest that the increase in BAT thermogenesis may be an additional mechanism whereby pharmacological GLP-1R activation controls energy balance.


Figures

FIG. 1.
FIG. 1.
Central chronic infusion of GLP-1R and GCGR agonists induces sustained body weight (BW) loss. ICV GLP-1 and OXM significantly reduced feeding (A, chow fed and B, DIO) and body weight (C, chow fed and D, DIO) in chow-fed and high-fat diet (HFD)-fed DIO mice. ICV GCG did not affect feeding in lean chow-fed mice (E) but reduced food intake in DIO mice (F). Despite the lack of an anorectic effect, ICV GCG significantly reduced body weight in lean chow-fed mice (G) and in DIO mice (H). Data are expressed as mean ± SE percentage of change (for body weight) or kilojoules (kJ) (for food intake) vs. the corresponding control group (n = 6–8). A significant main effect was required before post hoc testing. (P < 0.05, two-way repeated-measures ANOVA.) **P < 0.01, *P < 0.05 vs. corresponding vehicle (VH); two-way ANOVA with Bonferroni post hoc test. For C and D, the asterisks above relate to OXM, and those below relate to GLP-1.
FIG. 2.
FIG. 2.
Acute central injection of GLP-1R and GCGR agonists increases BAT thermogenesis. BAT temperature (Temp) was increased with acute ICV administration of GCG (A), OXM (B), and GLP-1 (C). Repeated-measures ANOVA showed significant main effects for GLP-1 and OXM and a main-effect P value of 0.08 for GCG across the 24-h period. Average iBAT temperature over the first half of the dark phase was significantly higher for all compounds (D-F) as determined by a t test (*P < 0.05, **P < 0.01). Two-hour food intake after injection and onset of the dark phase was significantly depressed in OXM (H) and GLP-1 (I) but unaffected with GCG (G) as determined by a t test (**P < 0.01). J: 12 h of fasting significantly reduces iBAT temperature, with normal temperature reinstated after a meal (2 g chow, indicated by arrow); repeated-measures ANOVA shows significant main effect during the dark phase only (P < 0.05). K: Intraperitoneal injection of the same nanomole dose of peptides as used in AI did not affect iBAT thermogenesis; individual t tests for each dark and light phase, P > 0.05. In contrast with ICV GLP-1 (N), ICV GCG, OXM, or food restriction did not significantly affect the home cage locomotor activity (Loc. Act) despite their effect on iBAT temperature (L, M, and O, respectively). Data are expressed as means ± SE (n = 6–8). ***P < 0.01 vs. vehicle (VH); two-way ANOVA with Bonferroni post hoc test. hr, hour; Ad Lib, ad libitum; cnts, counts.
FIG. 3.
FIG. 3.
Acute central injection of GLP-1R and GCGR agonists increases electrophysiological activity of the sympathetic fibers that innervate the iBAT. Activity of sympathetic nerves projecting to iBAT increased after acute ICV administration of GCG (A), OXM (B), or GLP-1 (C). Repeated-measures ANOVA shows a significant main effect for all compounds at all doses; P < 0.01. DF: Histograms on the right show average % increase for final hour, which was significant for all compounds as determined by one-way ANOVA with Tukey post hoc (D and E) and Student t test (F) (*P < 0.05, **P < 0.01). Data are expressed as means ± SE (n = 6–8). VH, vehicle.
FIG. 4.
FIG. 4.
Chronic CNS infusion of OXM induces a sustained increase in BAT thermogenesis that requires a functional GLP-1R. ICV infusion of OXM induces a sustained increase in iBAT thermogenesis over the course of 6 days in WT mice (A), which is completely absent in the Glp1r−/− mouse (B). The average increase over 5 days in iBAT temperature induced by OXM is significant in both the light and dark phases in WT mice (C) but not in the Glp1r−/− mice (D). The ICV OXM–induced iBAT thermogenesis does not correlate with increased plasma T3, as measured at the end of the study (E). Food intake (F and G) and home cage locomotor activity (Loc. Act) (H and I) of WT and Glp1r−/− mice during the period of ICV OXM infusion. Data are expressed as means ± SE (n = 6–8). *P < 0.05, **P < 0.01 vs. corresponding vehicle (VH); two-way ANOVA with Bonferroni post hoc test. KO, knockout; cnts, counts.
FIG. 5.
FIG. 5.
CNS infusion of OXM increases the expression of genes involved in thermogenesis in the iBAT of WT mice but not in Glp1r−/− mice. PGC1a (A), UCP-1 (B), DIO2 (C), and FGF21 (D) gene expression in BAT is increased in WT but not in GLP-1R knockout mice after 3-day ICV OXM infusion. Similarly, ICV OXM increased the expression of genes involved in energy metabolism, such as MCT1 (E), GLUT-4 (F), LPL (G), AACS (H), FASN (I), CPT1B (J), PRDM16(K), and NRF1(L) in iBAT of WT mice. WT vehicle (VH)-treated mice were pair-fed with the WT OXM group. Data are expressed as means ± SE (n = 6–8). *P < 0.05, **P < 0.01, **P < 0.001 vs. corresponding vehicle; two-way ANOVA with Bonferroni post hoc test. KO, knockout; a.u., arbitrary unit.
FIG. 6.
FIG. 6.
GLP-1R signaling is not critical for the control of BAT thermogenesis in response to changes in ambient temperature. WT and Glp1r−/− mice implanted with a telemeter temperature transmitter in the iBAT were exposed to decreasing ambient temperature from 24 to 14°C in decrements of 2°C per day. The decrease in ambient temperature led to a similar increase in food intake (A) in both WT and Glp1r−/− mice paralleled by an increase in locomotor activity (Loc. Act) (B) and energy expenditure (EE) (C). Both WT and knockout mice maintained similar iBAT temperature, including circadian-dependent oscillations (D). EJ: Response to an acute cold exposure: WT and Glp1r−/− mice fed with standard chow ad libitum and housed always at room temperature were singly housed and exposed to 4°C for 8 h. BCT was measured using a rectal probe (E). Another set of mice was exposed to 4°C for 2 h before euthanasia, while the corresponding control groups were maintained at room temperature. UCP-1 (F), PGC1a (G), and DIO2 (H) gene expression was assessed in BAT. Fat mass was measured using nuclear magnetic resonance to calculate adiposity (I). iBAT was carefully dissected and weighed (J). Food was removed at the beginning of the cold exposure, which started 2 h after the onset of the light phase. Data are expressed as means ± SE (AE, n = 8; FJ, n = 5–6). ##P < 0.01 Glp1r−/− vs. WT; ***P < 0.001 vs. corresponding vehicle; two-way ANOVA with Bonferroni post hoc test. Temp, temperature; cnts, counts; KO, knockout.

References

    1. Wren AM, Bloom SR. Gut hormones and appetite control. Gastroenterology 2007;132:2116–2130 - PubMed
    1. Astrup A, Rössner S, Van Gaal L, et al. NN8022-1807 Study Group Effects of liraglutide in the treatment of obesity: a randomised, double-blind, placebo-controlled study. Lancet 2009;374:1606–1616 - PubMed
    1. Kanoski SE, Fortin SM, Arnold M, Grill HJ, Hayes MR. Peripheral and central GLP-1 receptor populations mediate the anorectic effects of peripherally administered GLP-1 receptor agonists, liraglutide and exendin-4. Endocrinology 2011;152:3103–3112 - PMC - PubMed
    1. Heppner KM, Habegger KM, Day J, et al. Glucagon regulation of energy metabolism. Physiol Behav 2010;100:545–548 - PubMed
    1. Pocai A, Carrington PE, Adams JR, et al. Glucagon-like peptide 1/glucagon receptor dual agonism reverses obesity in mice. Diabetes 2009;58:2258–2266 - PMC - PubMed

Publication types

MeSH terms