. 2012 Oct 1;189(7):3669-80.
doi: 10.4049/jimmunol.1103180. Epub 2012 Aug 29.

IL-10 triggers changes in macrophage phenotype that promote muscle growth and regeneration

Affiliations

IL-10 triggers changes in macrophage phenotype that promote muscle growth and regeneration

Bo Deng et al. J Immunol. .

Abstract

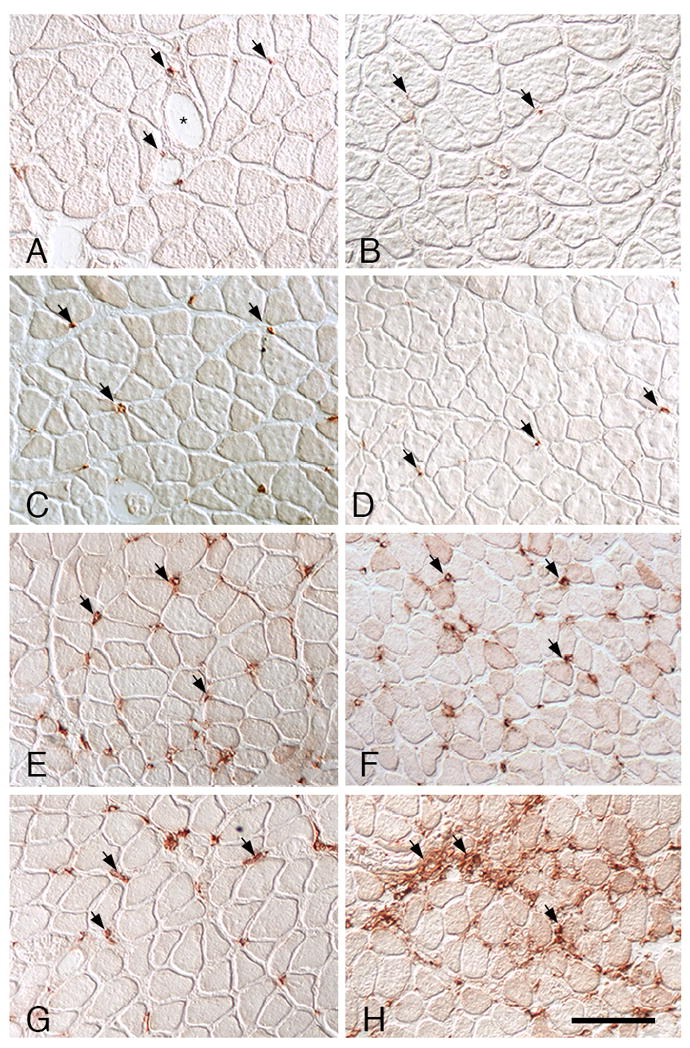
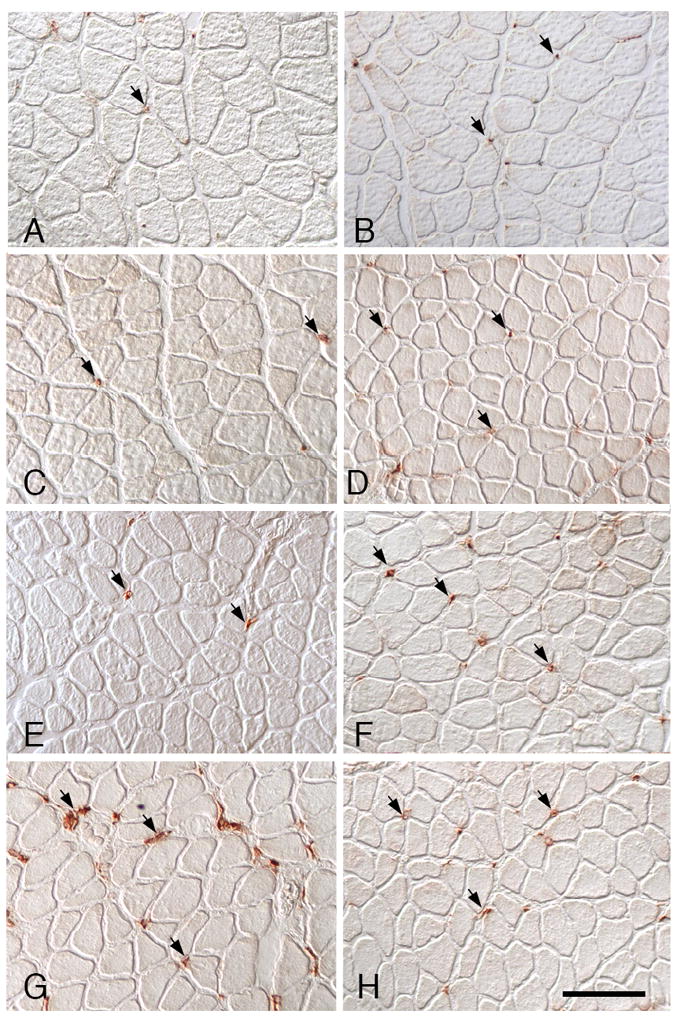
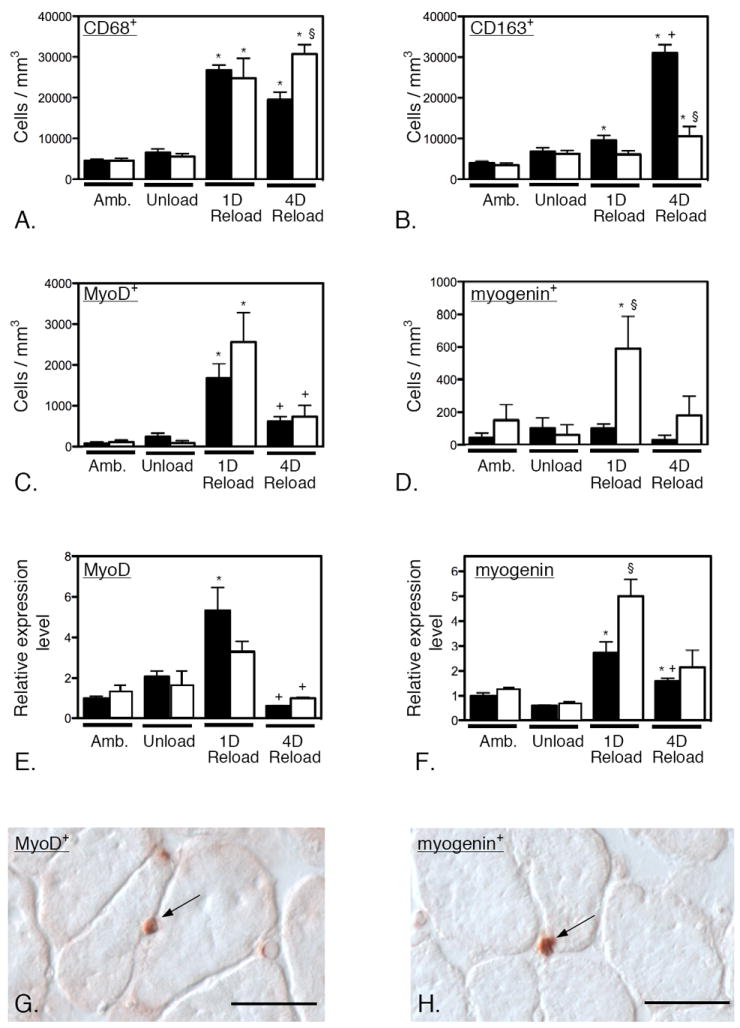
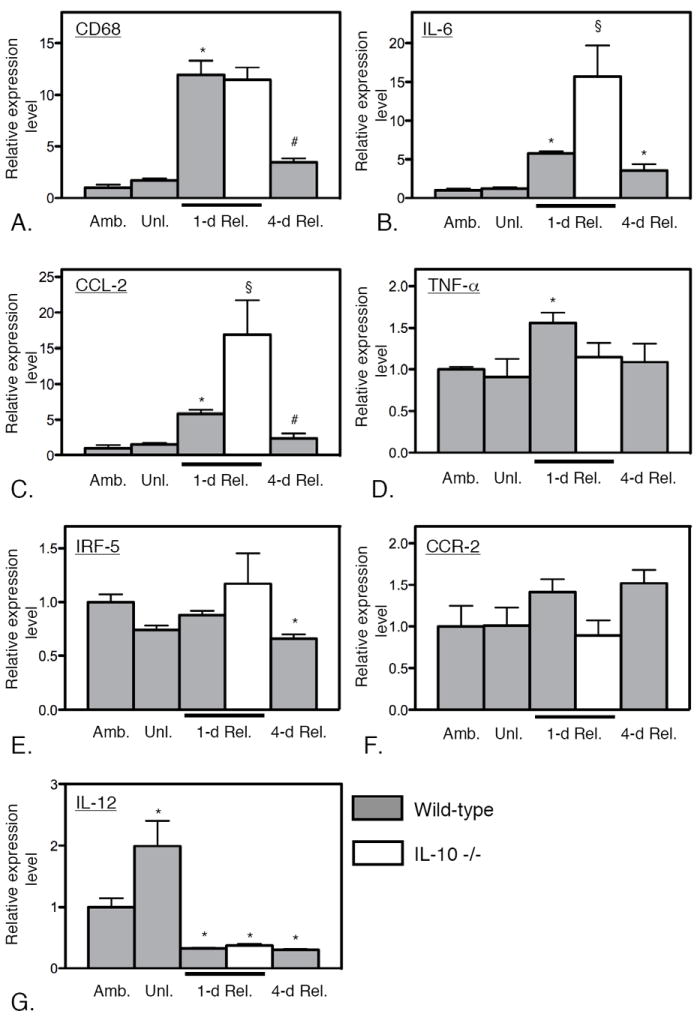
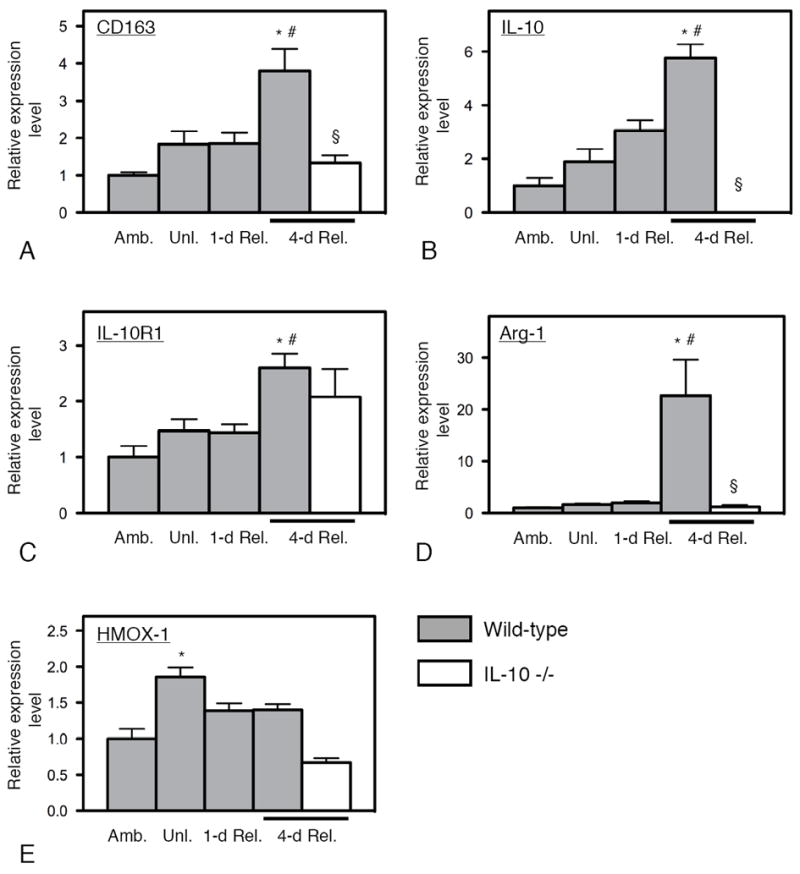
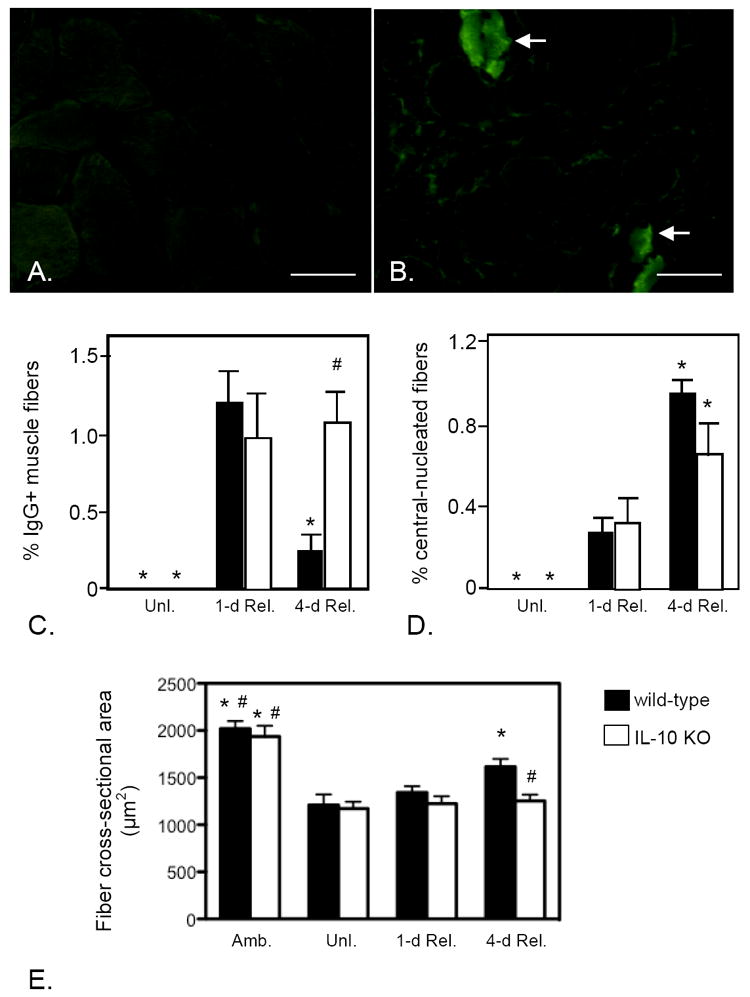
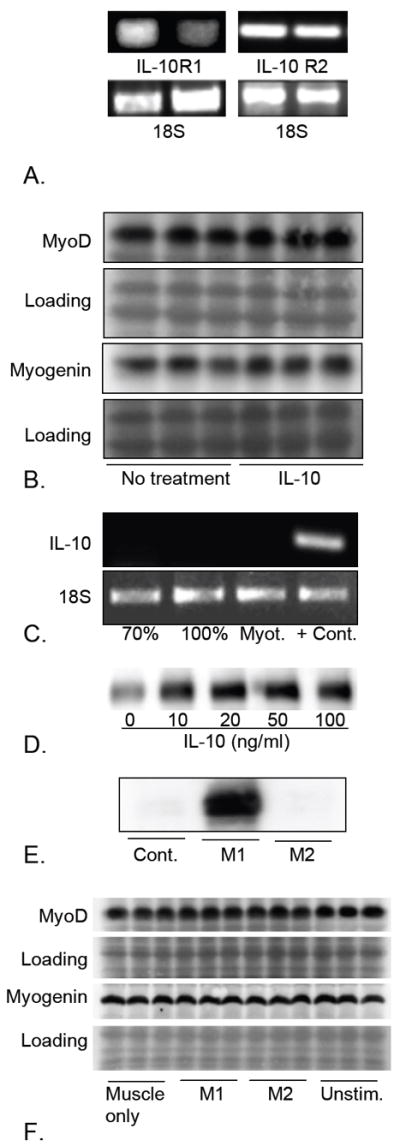
We examined the function of IL-10 in regulating changes in macrophage phenotype during muscle growth and regeneration following injury. Our findings showed that the Th1 cytokine response in inflamed muscle is characterized by high levels of expression of CD68, CCL-2, TNF-α, and IL-6 at 1 d postinjury. During transition to the Th2 cytokine response, expression of those transcripts declined, whereas CD163, IL-10, IL-10R1, and arginase-1 increased. Ablation of IL-10 amplified the Th1 response at 1 d postinjury, causing increases in IL-6 and CCL2, while preventing a subsequent increase in CD163 and arginase-1. Reductions in muscle fiber damage that normally occurred between 1 and 4 d postinjury did not occur in IL-10 mutants. In addition, muscle regeneration and growth were greatly slowed by loss of IL-10. Furthermore, myogenin expression increased in IL-10 mutant muscle at 1 d postinjury, suggesting that the mutation amplified the transition from the proliferative to the early differentiation stages of myogenesis. In vitro assays showed that stimulation of muscle cells with IL-10 had no effect on cell proliferation or expression of MyoD or myogenin. However, coculturing muscle cells with macrophages activated with IL-10 to the M2 phenotype increased myoblast proliferation without affecting MyoD or myogenin expression, showing that M2 macrophages promote the early, proliferative stage of myogenesis. Collectively, these data show that IL-10 plays a central role in regulating the switch of muscle macrophages from a M1 to M2 phenotype in injured muscle in vivo, and this transition is necessary for normal growth and regeneration of muscle.


Figures

Figure 1
Figure 1
CD68+ macrophage distribution in soleus muscles. A, C, E, G: Wild-type muscles. B, D, F, H: IL-10 null mutant muscles. A, B: Ambulatory control muscles showing CD68+ macrophages (arrows) in the endomysium surrounding muscles. CD68+ macrophages in wild-type muscles were frequently near blood vessels (*). C, D: In muscles experiencing unloading without subsequent reloading, the numbers and distribution of CD68+ macrophages were similar as observed in ambulatory controls. Muscle fiber diameters are reduced because of atrophy during unloading. E, F: At 1-day of muscle reloading following unloading, both wild-type and IL-10 null muscles show identical increases in the numbers of CD68+ macrophages. G, H: At 4-days of reloading, CD68+ macrophage numbers have begun to decline in wild-type muscle but remain elevated in IL-10-null muscle. All images are at the same magnification; bar = 100 μm.
Figure 2
Figure 2
CD163+ macrophage distribution in soleus muscles. A, C, E, G: Wild-type muscles. B, D, F, H: IL-10 null mutant muscles. A, B: Ambulatory control muscles showing CD163+ macrophages (arrows) in the endomysium surrounding muscles. C, D: In muscles experiencing unloading only, the numbers and distribution of CD163+ macrophages did not differ from ambulatory controls and fibers are atrophied. E, F: At 1-day of muscle reloading, both wild-type and IL-10 null muscles show numbers of CD163+ macrophages that are similar to ambulatory controls. G, H: At 4-days of reloading, CD163+ macrophage numbers have increased substantially in wild-type muscle, but show little increase in IL-10-null muscles. All images are at the same magnification; bar = 100 μm.
Figure 3
Figure 3
Null mutation of IL-10 amplifies CD68high macrophage numbers, reduces M2 macrophage numbers and perturbs myogenin expression in injured muscle. A – D: Cell counts of CD68+ (A), CD163+ (B), MyoD+ (C) and myogenin+ (D) cells in soleus muscles of wild-type and IL-10 null mutants over the time-course on muscle unloading and reloading. A. Numbers of CD68+ macrophages are elevated at 1-day of reloading in wild-type and mutant muscles and CD68+ cell numbers begin to decline after 1-day of muscle reloading of wild-type muscle. However, IL-10 null mutants do not experience a decline in CD68+ cells at 4-days of reloading. B. Numbers of CD163+ macrophages are elevated slightly in wild-type muscles at 1-day reloading, but not in mutant muscles at that time-point. Numbers of CD163+ cells are elevated in both wild-type and mutant muscles at 4-days reloading, but the numbers are greatly amplified in wild-type muscles. C. The numbers of MyoD-expressing satellite cells show similar increases in both wild-type and mutant muscles at 1-day of reloading and similar reductions in numbers at 4-days reloading. D. The numbers of myogenin-expressing satellite cells show large increases in mutant muscle at 1-day of reloading, although their numbers do not change significantly in wild-type muscles at that time-point. E and F. QPCR data showing changes in the levels of expression of MyoD (E) and myogenin (F) over the course of muscle unloading and reloading. The changes in gene expression for the two transcripts resemble the changes in numbers of MyoD+ and myogenin+ cells shown in Figures 3C and 3D. * indicates significantly different from ambulatory control muscle of same genotype at p < 0.05. § indicates significantly different from wild-type muscle under the same treatment conditions at p < 0.05. + indicates significantly different from 1-day reloaded muscle of same genotype at p < 0.05. Each bar represents the mean and sem for the muscles collected from 5 mice in each data set. All data in each set were normalized relative to expression levels in ambulatory, wild-type muscles which were set at 1.0. G. Image showing an anti-MyoD labeled satellite cell (arrow) at the surface of a muscle fiber in 1-day reloaded, IL-10 null muscle. H. Image showing an anti-myogenin labeled satellite cell (arrow) at the surface of a muscle fiber in 4-days reloaded, IL-10 null muscle. Bars = 40 μm.
Figure 4
Figure 4
Levels of expression of transcripts related to the Th1 cytokine response during muscle unloading and reloading. Expression levels of CD68 (A), IL-6 (B), CCL-2 (C) and TNF-α (D) were all elevated at 1-day of reloading in wild-type muscles, reflecting a Th1 cytokine response, although IRF-5 (E), CCR-2 (F) and IL-12 (G) were not elevated at that stage. The transcripts that were elevated at 1-day reloading were all significantly reduced by 4-days of reloading, reflecting resolution of the Th1 cytokine response. Null mutation of IL-10 amplified the Th1 cytokine response at 1-day of reloading, reflected in significant elevations of IL-6 and CCL-2. * indicates significantly different from ambulatory control muscle of same genotype at p < 0.05. § indicates significantly different from wild-type muscle under the same treatment conditions at p < 0.05. # indicates significantly different from 1-day reloaded muscle of same genotype at p < 0.05. Each bar represents the mean and sem for the muscles collected from 6 mice in each data set. All data in each set were normalized relative to expression levels in ambulatory, wild-type muscles which were set at 1.0.
Figure 5
Figure 5
Levels of expression of transcripts related to the Th2 cytokine response during muscle unloading and reloading. Expression levels of CD163 (A), IL-10 (B), IL-10R1 (C) and Arg-1 (D) were all elevated at 4-days of reloading in wild-type muscles, reflecting a Th2 cytokine response, although HMOX-1 (E) was not elevated at that stage. Null mutation of IL-10 attenuated the Th2 cytokine response at 4-days of reloading, reflected in significant reductions of CD163 and Arg-1. * indicates significantly different from ambulatory control muscle of same genotype at p < 0.05. § indicates significantly different from wild-type muscle under the same treatment conditions at p < 0.05. # indicates significantly different from 1-day reloaded muscle of same genotype at p < 0.05. Each bar represents the mean and sem for the muscles collected from 6 mice in each data set. All data in each set were normalized relative to expression levels in ambulatory, wild-type muscles which were set at 1.0.
Figure 6
Figure 6
IL-10 mutants experience reductions in muscle fiber repair, regeneration and growth during reloading. A, B: Cross-section of soleus muscles from wild-type (A) or IL-10 null mutant (B) mice from 4-days reloaded mice labeled with FITC-conjugated, anti-mouse IgG. The presence of IgG in the muscle fiber cytosol (arrows) indicates the presence of membrane lesions large enough to allow influx of IgG from the extracellular space. Bars = 100 μm. C: Quantification of the number of IgG+ muscle fibers in unloaded (Unl.), 1-day and 4-day reloaded muscles indicates that membrane lesions caused by muscle reloading are repaired between days 1 and 4 of reloading in wild-type, but not IL-10 mutant, muscles. D. Quantification of the proportion of central-nucleated muscle fibers in reloaded muscles shows that the increase in regenerative muscle fibers that occurs in wild-type muscles between in 1-day and 4-days reloading is diminished in IL-10 null mutants. E. Muscle fiber growth during reloading was assayed by measuring changes in cross-sectional area of the muscle fibers in soleus muscle sections. Note that fiber size in ambulatory controls (Amb.) did not differ between wild-type and IL-10 mutant muscles and that mutation of IL-10 did not affect the atrophy of fibers that occurred during unloading (Unl.). However, fiber growth that occurred during 4-days of reloading did not occur in IL-10 mutants. Each bar represents the mean and sem for the muscles collected from 6 mice in each data set. * indicates significantly different from 1-day reloaded muscle of the same genotype at p < 0.05. # indicates significantly different from 4-days reloaded wild-type muscle at p < 0.05.
Figure 7
Figure 7
MyoD and myogenin expression are unaffected by direct stimulation with IL-10 or co-culture with IL-10 stimulated M2 macrophages. A. RT-PCR was used to confirm that C2C12 myoblasts can express both IL-10R1 and IL-10R2. The 18S ribosomal subunit was used as a loading control. B. Western blots of muscle cell extracts following treatment with 10 ng/mg IL-10 shows that direct application of IL-10 for 24 hours did not affect expression of MyoD or myogenin. Ponceau red staining of membranes that were subsequently used for antibody incubations was used to confirm uniform loading of the gels and transfer of proteins to the membrane (loading). The western blots that are shown are representative of three independent experiments. C: RT-PCR showed that muscle cells in vitro do not express IL-10, showing that lack of treatment effect with exogenous IL-10 was not attributable to saturation by endogenous IL-10. Lane 1 sample was obtained from 70% confluent cultures of proliferative muscle cells. Lane 2 was from 100% confluent cultures. Lane 3 was obtained from differentiated myotube (Myot.) cultures, 2-days after transfer to differentiation medium. Lane 4 used RNA isolated from inflamed, dystrophic muscle from mice in the mdx line, as a positive control. The 18S ribosomal subunit is used as a loading control. The results are representative of those obtained from 3 independent experiments. D. Western blot of extracts of macrophages stimulated with IL-10 for 24 hours. IL-10 induction of CD163 expression indicates increased activation to the M2 phenotype. The blot is representative of 3 independent experiments. E. Western blot of extracts of macrophages stimulated with TNF-α and IFNγ for 24 hours. Induction of iNOS indicates activation to the M1 phenotype. F. Western blot of extracts of myoblasts cultured in the absence of macrophages (Muscle only), or in the presence of M1 macrophages activated by TNF-α and IFNγ (M1), or in the presence of M2 macrophages stimulated with IL-10 (M2) or macrophages that were not treated with cytokines (Unstim.) No detectable changes in the levels of expression of MyoD or myogenin were observed in any co-culture conditions, compared to myoblasts alone. The results are representative of those obtained from 3 independent experiments. Ponceau red staining of the western blot membranes (Loading) was used to confirm uniform loading and transfer of samples.

References

    1. Tidball JG, Villalta SA. Regulatory interactions between muscle and the immune system during muscle regeneration. Amer J Physiol. 2010;298:R1173–1187. - PMC - PubMed
    1. Smith JK, Grisham MB, Granger DN, Korthuis RJ. Free radical defense mechanisms and neutrophil infiltration in postischemic skeletal muscle. Am J Physiol. 1989;256:H789–793. - PubMed
    1. Nguyen HX, Lusis AJ, Tidball JG. Null mutation of myeloperoxidase in mice prevents mechanical activation of neutrophil lysis of muscle cell membranes in vitro and in vivo. J Physiol. 2005;565:403–413. - PMC - PubMed
    1. Nguyen HX, Tidball JG. Null mutation of gp91phox reduces muscle membrane lysis during muscle inflammation in mice. J Physiol. 2003;553:833–841. - PMC - PubMed
    1. Nguyen HX, Tidball JG. Interactions between neutrophils and macrophages promote macrophage killing of rat muscle cells in vitro. J Physiol. 2003;547:125–132. - PMC - PubMed

Publication types

MeSH terms