. 2012 Oct 1;189(7):3368-77.
doi: 10.4049/jimmunol.1102613. Epub 2012 Aug 29.

IRF4 promotes cutaneous dendritic cell migration to lymph nodes during homeostasis and inflammation

Affiliations

IRF4 promotes cutaneous dendritic cell migration to lymph nodes during homeostasis and inflammation

Sandra Bajaña et al. J Immunol. .

Abstract

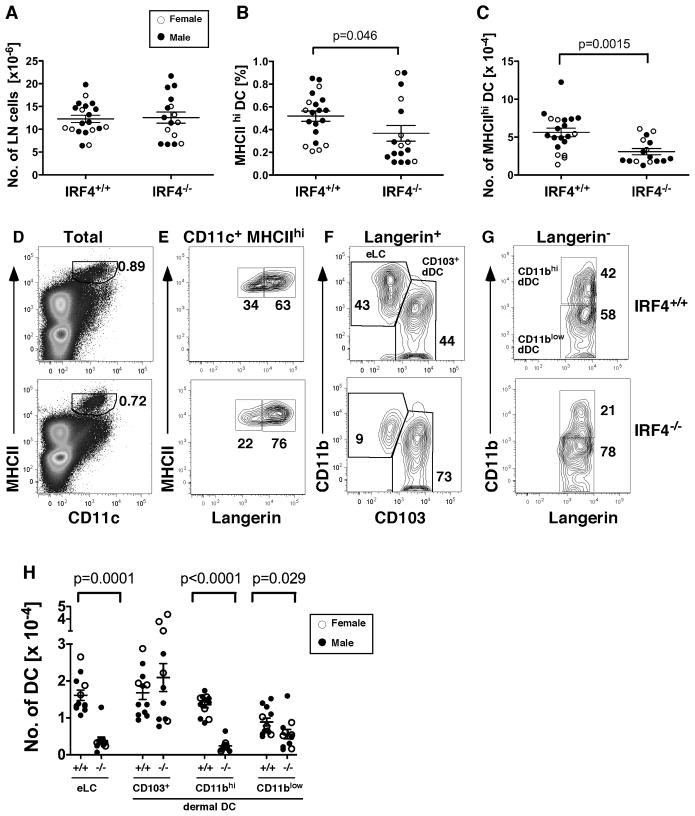
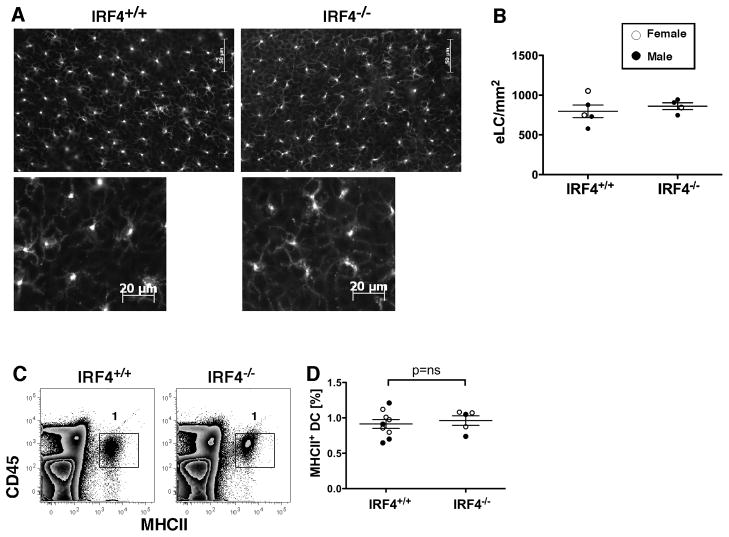
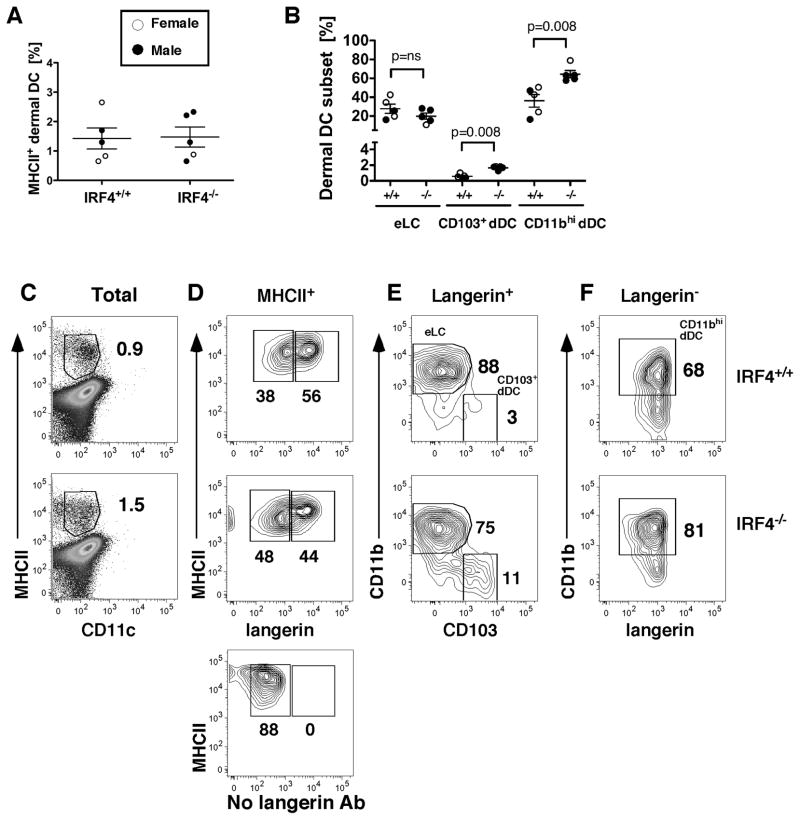
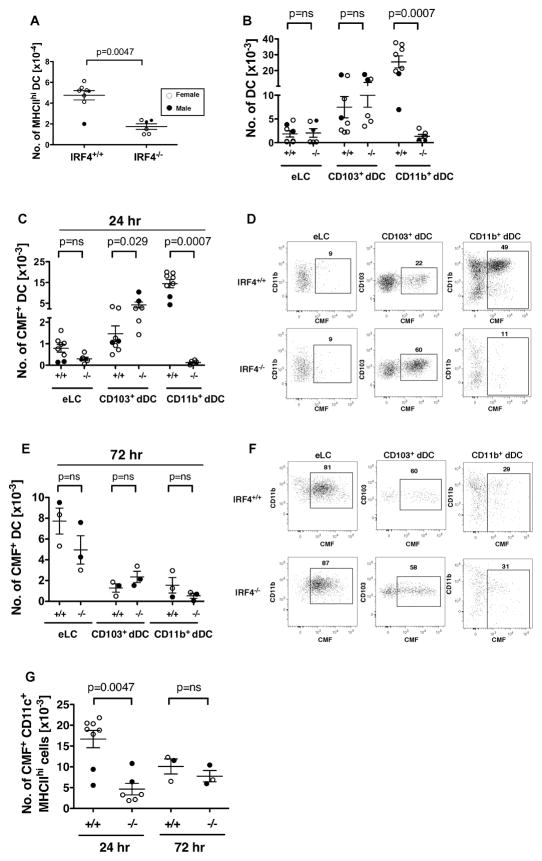
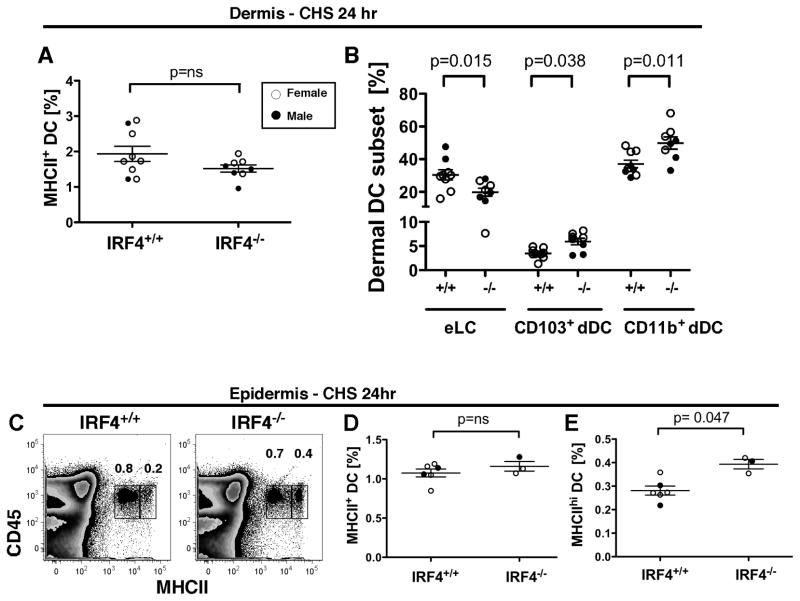
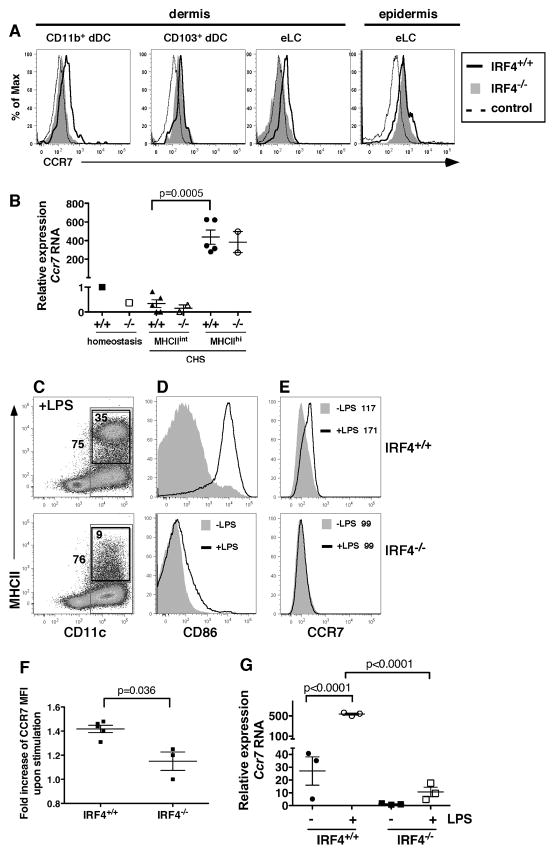
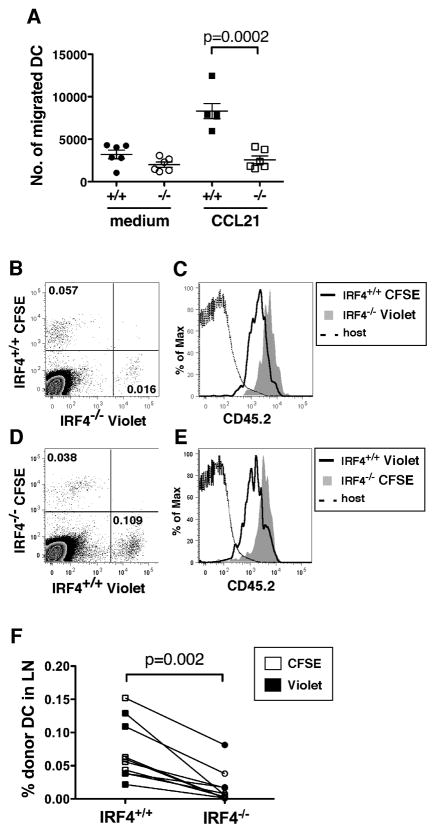
Migration of resident dendritic cells (DC) from the skin to local lymph nodes (LN) triggers T cell-mediated immune responses during cutaneous infection, autoimmune disease, and vaccination. In this study, we investigated whether the development and migration of skin-resident DC were regulated by IFN regulatory factor 4 (IRF4), a transcription factor that is required for the development of CD11b(+) splenic DC. We found that the skin of naive IRF4(-/-) mice contained normal numbers of epidermal Langerhans cells (eLC) and increased numbers of CD11b(+) and CD103(+) dermal DC (dDC) populations, indicating that tissue DC development and skin residency is not disrupted by IRF4 deficiency. In contrast, numbers of migratory eLC and CD11b(+) dDC were significantly reduced in the cutaneous LN of IRF4(-/-) mice, suggesting a defect in constitutive migration from the dermis during homeostasis. Upon induction of skin inflammation, CD11b(+) dDC in IRF4(-/-) mice did not express the chemokine receptor CCR7 and failed to migrate to cutaneous LN, whereas the migration of eLC was only mildly impaired. Thus, although dispensable for their development, IRF4 is crucial for the CCR7-mediated migration of CD11b(+) dDC, a predominant population in murine and human skin that plays a vital role in normal and pathogenic cutaneous immunity.


Conflict of interest statement

Conflict of Interest Disclosures

None.

Figures

Fig. 1
Fig. 1. IRF4−/− cLN have reduced numbers of epidermal Langerhans cells and dermal CD11b+ DC
(A) Total numbers of inguinal LN cells in IRF4+/+ and IRF4−/− mice. In all graphs, symbols indicate individual female (open circles) and male (closed circles) mice. The mean and SEM are indicated. (B) The fraction of MHCIIhi CD11c+ DC and (C) the numbers of MHCIIhi CD11c+ DC in individual mice were determined by flow cytometry. (D) Shown is the gating of MHCIIhi CD11c+ DC (percentage indicated) within total LN cells. The gating of (E) langerin+ and langerin DC within the MHCIIhi CD11c+ fraction, (F) CD103+ and CD11bhi DC within the langerin+ fraction, and (G) CD11bhi and CD11blow DC within the langerin fraction. (H) The numbers of eLC (CD11bhilangerin+CD103), CD103+ dDC (CD11blowlangerin+CD103+), CD11bhi dDC (CD11bhilangerinCD103) and CD11blow dDC (CD11blowlangerinCD103) in LN of IRF4+/+ (+/+) and IRF4−/− (−/−) mice. The data were analyzed using a two-way ANOVA with Bonferroni post tests to identify significant differences between sex and genotype. The variance was not due to a genotype x sex interaction. Therefore we used a nonparametric Mann-Whitney test on combined male and female data (n=16–20) to determine significant differences in IRF4+/+ and IRF4−/− genotypes; p values are indicated. A significant sex difference was present only within the CD103+ dDC population in both IRF4+/+ and IRF4−/− mice (two-way ANOVA, p=0.0089).
Fig. 2
Fig. 2. Numbers of epidermal Langerhans cells are similar in IRF4+/+ and IRF4−/− mice in homeostasis
(A) Epidermal sheets from ear skin of IRF4+/+ and IRF4−/− mice stained with an anti-langerin Ab. Lower panels show DC morphology at a higher magnification. (B) Numbers of eLC/mm2 in individual female (open circles) and male (closed circles) mice (n=4–5 per genotype). The data were analyzed using a Mann-Whitney test. (C) Epidermal eLC within a preparation of ear skin epidermal cells were identified by expression of CD45.2 and MHCII. (D) The percentage of MHCII+ DC in the epidermis of multiple mice was determined (n=5–9).
Fig. 3
Fig. 3. The dermis of IRF4−/− mice has an increased proportion of both CD11b+ and CD103+ dDC subsets in homeostasis
(A) The percentage of MHCII+ cells in the dermis in individual mice. (B) The percentage of each DC subset within the MHCII+ fraction in the dermis of individual mice. (C) Gating of MHCII+ cells (percentage indicated) within a dermal cell suspension. (D) Gating of langerin+ and langerin populations within the MHCII+ cells of the dermis. The lower panel shows a “fluorescence minus one” staining in which the anti-langerin Ab was omitted. (E) Gating of the CD11b+ eLC and CD103+ dDC within the langerin+ population. (F) Gating of CD11bhi dDC within the langerin population. In all graphs, females (open circles) and males (closed circles) are indicated. The p values indicate significant differences in IRF4+/+ and IRF4−/− genotypes (males and females combined), determined using a nonparametric Mann-Whitney test, n=5.
Fig. 4
Fig. 4. In contact hypersensitivity, CD11b+ dermal DC fail to migrate to cutaneous LN while cell tracker-bearing CD103+ dDC migrate in increased numbers in IRF4−/− mice
(AD) Dibutyl phthalate-acetone (1:1) and the fluorescent cell tracker CMFDA were applied to ear skin, and cLN cells were harvested after 24 hr. (A) The number of MHCIIhi CD11c+ DC in the draining auricular LN. (B) Relative to eLC and CD103+ dDC, the total number of CD11b+ dDC was significantly reduced in LN of IRF4−/− mice. (C) The number of CMF+ cells within the CD11b+ dDC subset was significantly reduced, and the number of CMF+ cells within the CD103+ dDC subset was significantly increased, 24 hr post-CHS in LN of IRF4−/− mice. (D) Gating of CMF+ cells within the indicated migratory DC subset in cLN at 24 hr. (E–F) Dibutyl phthalate-acetone (1:1) and CMFDA were applied to ear skin, and cLN cells were harvested after 72 hr. (E) The number of CMF+ cells within each migratory DC subset was determined. (F) Gating of CMF+ cells within the indicated migratory DC subset in cLN at 72 hr. (G) The number of CMF+ cells with the gated MHCIIhi CD11c+ fraction (as in Fig. S3A) in IRF4+/+ and IRF4−/− cLN at 24 and 72 hr post-CHS was determined. In all graphs, females (open circles) and males (closed circles) are indicated. The p values indicate significant differences in the IRF4+/+ and IRF4−/− genotypes (males and females combined), determined using a nonparametric Mann-Whitney test, n=3–8.
Fig. 5
Fig. 5. In contact hypersensitivity, IRF4−/− mice have an increased percentage of CD11b+ and CD103+ dDC subsets in the dermis and MHCIIhi DC in the epidermis
(A–B) Dibutyl phthalate-acetone (1:1) and the fluorescent cell tracker CMFDA were applied to ear skin, and dermal cells were harvested after 24 hr. Dermal DC subsets were identified by flow cytometry as in Fig. S3. The percentage of (A) total MHCII+ cells and (B) each DC subset within the MHCII+ population in the dermis of multiple mice was determined. (C–E) Dibutyl phthalate-acetone (1:1) and the fluorescent cell tracker CMFDA were applied to ear skin, and epidermal cells were harvested after 24 hr. (C) CD45+ epidermal DC were distinguished by two distinct levels of MHCII. The percentage of (D) total MHCII+ DC and (E) MHCIIhi DC in the epidermis of multiple mice was determined. In all graphs, females (open circles) and males (closed circles) are indicated. The p values indicate significant differences in the IRF4+/+ and IRF4−/− genotypes (males and females combined), determined using a nonparametric Mann-Whitney test, n=3–9.
Fig. 6
Fig. 6. IRF4−/− DC in the dermis show reduced expression of CCR7
(A) Dibutyl phthalate-acetone (1:1) and the fluorescent cell tracker CMFDA were applied to ear skin, and dermal and epidermal cells were harvested after 24 hr. The gating of dermal and epidermal DC subsets is shown in Fig. S3 and Fig. 5C. (A) Expression of CCR7 on CD11b+ dDC, CD103+ dDC and eLC subsets in dermis and total MHCII+ eLC in the epidermis of IRF4+/+ (thick solid line) and IRF4−/− (shaded histogram) mice. The dotted line (control) indicates cells stained for DC markers but not CCR7 (“fluorescence minus one” control). The graphs are representative of 3–4 mice of each genotype. (B) CD45+ MHCII+ eLC were sorted from a pooled epidermal cell suspension derived from 3–5 mice during homeostasis (as in Fig. 2C), and separate populations of MHCIIint and MHCIIhi eLC were sorted from the epidermis of individual mice (n=2–5) 24 hr after application of dibutyl phthalate-acetone (1:1) and the fluorescent cell tracker CMFDA (as in Fig. 5C). The relative expression of Ccr7 RNA was determined using qPCR. For the eLC isolated during homeostasis, the data point is the mean of triplicates of the pooled sample (3–5 mice) for the PCR reaction. For the eLC isolated post-CHS, each data point is the mean of triplicates of a sample from a single mouse for the PCR reaction. The significance of the difference between Ccr7 RNA levels in populations of MHCIIint and MHCIIhi eLC in IRF4+/+ mice was evaluated using an unpaired t test. (C–G) DC were differentiated via GM-CSF from bone marrow cells isolated from IRF4+/+ (top panels) and IRF4−/− (bottom panels) mice, and stimulated with LPS for 12–18 hr. (C) In LPS-stimulated cells, the outer box indicates the gating of total CD11c+ cells (75% IRF4+/+ vs. 76% IRF4−/−) and the inset box indicates the gating of CD11c+ MHCII+ DC (35% IRF4+/+ vs. 9% IRF4−/−). The graphs are representative of 3–5 mice of each genotype. (D) The expression of CD86 on resting or LPS-stimulated DC (gated on total CD11c+ cells) is shown. (E) The expression of CCR7 on resting or LPS-stimulated DC (gated on total CD11c+ cells) is shown. The mean fluorescence intensity (MFI) of the overlying histograms is indicated. (F) Fold increase in CCR7 MFI on LPS-stimulated CD11c+ cells (relative to CCR7 MFI on resting cells, as in panel E) in cultures generated from individual mice of each genotype, n=3–5. The significance of these data was evaluated using a Mann-Whitney test. (G) IRF4+/+ and IRF4−/− DC generated from the bone marrow of individual mice were left unstimulated or stimulated for 12 hr with LPS. The relative expression of Ccr7 RNA was determined using qPCR; each data point is the mean of triplicates of an individual sample for the PCR reaction. The significance of these data (n=3) was evaluated using a one-way ANOVA followed by a Bonferroni’s multiple comparison test.
Fig. 7
Fig. 7. IRF4−/− DC show an intrinsic defect in migration in vitro and in vivo
(A) Migration of LPS-activated IRF4+/+ and IRF4−/− bone marrow-derived DC toward the chemokine CCL21 in a transwell chemotaxis assay. Data points represent the number of migrated DC in individual wells; DC are from 2 IRF4+/+ and 2 IRF4−/− mice (3 wells each). Data were evaluated using an unpaired t test. (B–F) LPS-activated IRF4+/+ and IRF4−/− bone marrow-derived DC (CD45.2+) labeled with CFSE or Cell Trace Violet were mixed together in equal numbers and injected intra-dermally into recipient CD45.1+ mice. Inguinal LN were analyzed for the presence of donor DC after 36 hr. (B) Identification of CFSE-labeled IRF4+/+ DC and Cell Trace Violet-labeled IRF4−/− DC among total LN cells. (C) Donor DC populations gated in panel B are CD45.2+. IRF4+/+ DC consistently expressed lower levels of CD45.2 than IRF4−/− DC, independent of the label used. (D) Identification of Cell Trace Violet-labeled IRF4+/+ DC and CFSE-labeled IRF4−/− DC among total LN cells. (E) Donor DC populations gated in panel D are CD45.2+. (F) Compilation of results using DC from 2 IRF4+/+ and 2 IRF4−/− mice each labeled with CFSE (open symbols) or Cell Trace Violet (closed symbols). The percentage of transferred DC among total LN cells is plotted. The significance of these data (n=10) was evaluated using a Wilcoxon matched-pairs signed rank test.

References

    1. Johnson-Huang LM, McNutt NS, Krueger JG, Lowes MA. Cytokine-producing dendritic cells in the pathogenesis of inflammatory skin diseases. J Clin Immunol. 2009;29:247–256. - PMC - PubMed
    1. Merad M, Hoffmann P, Ranheim E, Slaymaker S, Manz MG, Lira SA, Charo I, Cook DN, Weissman IL, Strober S, Engleman EG. Depletion of host Langerhans cells before transplantation of donor alloreactive T cells prevents skin graft-versus-host disease. Nat Med. 2004;10:510–517. - PMC - PubMed
    1. Kaplan DH. In vivo function of Langerhans cells and dermal dendritic cells. Trends Immunol. 2010;31:446–451. - PMC - PubMed
    1. Ohl L, Mohaupt M, Czeloth N, Hintzen G, Kiafard Z, Zwirner J, Blankenstein T, Henning G, Forster R. CCR7 governs skin dendritic cell migration under inflammatory and steady-state conditions. Immunity. 2004;21:279–288. - PubMed
    1. Steinman RM, Nussenzweig MC. Avoiding horror autotoxicus: the importance of dendritic cells in peripheral T cell tolerance. Proc Natl Acad Sci U S A. 2002;99:351–358. - PMC - PubMed

Publication types

MeSH terms