. 2012 Aug 29;32(35):12038-50.
doi: 10.1523/JNEUROSCI.1790-12.2012.

Selectivity for three-dimensional shape and grasping-related activity in the macaque ventral premotor cortex

Affiliations

Selectivity for three-dimensional shape and grasping-related activity in the macaque ventral premotor cortex

Tom Theys et al. J Neurosci. .

Abstract

Anatomical studies indicate that area F5 in the macaque ventral premotor cortex consists of three different sectors. One of these is F5a in the posterior bank of the inferior arcuate sulcus, but no functional characterization of F5a at the single-cell level exists. We investigated the neuronal selectivity for three-dimensional (3D) shape and grasping activity in F5a. In contrast to neighboring regions F5p and 45B, the great majority of F5a neurons showed selectivity for disparity-defined curved surfaces, and most neurons preserved this selectivity across positions in depth, indicating higher-order disparity selectivity. Thus, as predicted by monkey fMRI data, F5a neurons showed robust 3D-shape selectivity in the absence of a motor response. To investigate the relationship between disparity selectivity and grasping activity, we recorded from 3D-shape-selective F5a neurons during a visually guided grasping task and during grasping in the dark. F5a neurons encoding the depth profile of curved surfaces frequently responded during grasping of real-world objects in the light, but not in the dark, whereas nearby neurons were also active in the dark. The presence of 3D-shape-selective and "visual-dominant" neurons demonstrates that the F5a sector is distinct from neighboring regions of ventral premotor cortex, in line with recent anatomical connectivity studies.


Figures
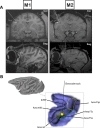
Figure 1.
Figure 1.
Recording positions in F5a. A, Coronal (top row) and sagittal (bottom row) MRI illustrating the most representative recording sites (arrows) and electrode tracks (lines) in the inferior arcuate sulcus in M1 (left) and M2 (right). B, Lateral view of the macaque brain and 3D rendering of the arcuate sulcus of M1. The inset shows an electrode penetration in the inferior limb of the arcuate sulcus in the center of the area with higher-order disparity-selective neurons (black line). The electrode track traversed area 45B and ended in the lateral bank of the arcuate sulcus (area F5a). The different subsectors of F5 have been indicated on the drawing. The gray area in the lateral bank of the inferior arcuate sulcus indicates the fMRI activation evoked by curved surfaces described by Joly et al. (2009).
Figure 2.
Figure 2.
Stimuli and tasks. A, The eight two-dimensional contours used to generate the 3D stimuli (top). Monocular images presented to the left eye and right eye and schematic illustrations of the perceived 3D structures (Gaussian, inclined, sine, half-period sine) are shown for one of the 2D contours. B, A schematic overview of the experimental setup from the monkeys' viewpoint with the carousel presenting one of the six different 3D objects (bottom) and the monitor used to present the 3D shapes (top). Neurons were tested either during presentation of 3D shapes on the monitor (passive fixation) or during the grasping of an object. C, Front view (top), side view (bottom left), and back view (bottom right) of the carousel with the six different objects. Note that the carousel was invisible to the monkey.
Figure 3.
Figure 3.
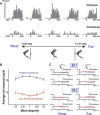
Disparity test. A, Responses of an example neuron in area F5a showing selectivity in the disparity test. The icons illustrate the depth profile of the stimuli: convex (top row) and concave (bottom row). The neuron was tested with 3D shapes (stereo) and monocular presentations of the same stimuli (monocular left eye and right eye). The vertical calibration bar indicates 50 spikes per second (bin width, 40 ms). Average horizontal eye position traces during presentation of the convex and concave shapes are plotted below the PSTHs for the left (red) and right (blue) eyes. B, Population response of all disparity-selective neurons (N = 178) in M1 (N = 98) and M2 (N = 80). The average responses to the preferred (blue) and the nonpreferred 3D shapes (red) are plotted as a function of time after stimulus onset (0). The thin vertical line indicates the latency of selectivity of the population response. The dashed lines represent the responses to the corresponding monocular stimuli. C, Histogram of SSI for all disparity-selective F5a neurons (N = 178). The last bar includes all cells that had an SSI of 1 or higher. D, Histogram of the selectivity latencies for all disparity-selective F5a neurons. The arrow indicates the median selectivity latency (130 ms).
Figure 4.
Figure 4.
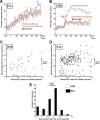
Position-in-depth test. A, Example neuron. A higher-order 3D shape selective neuron in area F5a (the same neuron as in Fig. 3A) showing robust responses to the preferred 3D shape at all positions in depth is shown. The vertical calibration bar indicates 50 spikes per second (bin width, 40 ms). B, Population response of higher-order selective F5a neurons (N = 131). The average net responses of all higher-order neurons to the preferred (blue) and the nonpreferred (red) 3D shape are plotted at the five different positions in depth. C, Eye position traces. Average horizontal eye position traces for the left (red) and right (blue) eyes are shown for the extreme near (left) and extreme far (right) positions in the position-in-depth test for the two monkeys (M1, M2) separately.
Figure 5.
Figure 5.
Responses in other periarcuate regions. A, Average response of all responsive neurons recorded in F5p/c (N = 20; same conventions as in Figure 3C). B, Average response of all disparity-selective neurons recorded in area 45B (N = 34; same conventions as in Figure 3C). C, Selectivity index at the middle position plotted against the selectivity index at the worst position (i.e., the smallest response to the preferred 3D shape compared to the strongest response to the nonpreferred 3D shape) for all disparity-selective neurons in area 45B (N = 34). Open symbols, Zero-order neurons; filled symbols, higher-order neurons. D, The same selectivity indices plotted for all disparity-selective neurons recorded in F5a (N = 171). E, Histogram of the selectivity index at the worst position for all disparity-selective neurons recorded in F5a (N = 171; filled bars) and area 45B (N = 34; open bars).
Figure 6.
Figure 6.
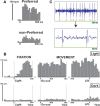
Grasping-related activity in F5a: SUA. A, Responses of an example neuron showing 3D-shape selectivity (preferred, convex depth profile; nonpreferred, concave depth profile). B, PSTH of the same neuron during visually guided grasping (top row) and during grasping in the dark (bottom row). The activity is aligned with the onset of the light illuminating the object (left), the GO cue (sound, middle), and the lifting of the object (right). Time 0 in the bottom row (arrow, left) indicates the point when the light would have been turned on if grasping would have been performed in the light. C, Raw signal trace (top) and magnified trace (bottom) recorded during grasping in the light illustrating SUA. Red squares indicate accepted spikes in the online spike discrimination.
Figure 7.
Figure 7.
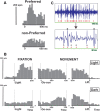
Grasping-related activity: MUA. A, PSTH of an example MUA recording site showing 3D shape selectivity. B, Grasping task. A PSTH of the same disparity-selective 3D site tested during grasping is shown. Same conventions as in Figure 6B. C, Raw signal trace (top) and magnified trace (bottom) recorded during grasping in the light illustrating MUA. Asterisks indicate the disparity-selective spikes, and diamonds indicate the visuomotor spikes.
Figure 8.
Figure 8.
Grasping task in the light: population analysis. For all 3D-shape-selective F5a neurons tested during visually guided grasping (N = 98), the net neuronal activity (spikes per second) during the fixation period is plotted against the activity during the movement period for the SUA sites (N = 46, filled diamonds) and the MUA sites (N = 52, open circles).
Figure 9.
Figure 9.
Grasping task: average population response. A, The average response of all 3D-shape-selective F5a neurons (black line; N = 98) tested during grasping in the light is plotted as a function of time after stimulus onset (left), at the time of GO cue (middle), and at the time of object lift (right). B, The average response of all 3D-shape-selective sites (N = 50; black line) tested during grasping in the dark is plotted as a function of time after stimulus onset (left), time of GO cue (middle), and time of object lift (right). The average responses of all higher-order visual (blue line; N = 30) and visuomotor (red line; N = 20) recording sites are plotted separately.

Similar articles

Cited by

References

    1. Belmalih A, Borra E, Contini M, Gerbella M, Rozzi S, Luppino G. Multimodal architectonic subdivision of the rostral part (area F5) of the macaque ventral premotor cortex. J Comp Neurol. 2009;512:183–217. - PubMed
    1. Borra E, Belmalih A, Calzavara R, Gerbella M, Murata A, Rozzi S, Luppino G. Cortical connections of the macaque anterior intraparietal (AIP) area. Cereb Cortex. 2008;18:1094–1111. - PubMed
    1. Castiello U, Begliomini C. The cortical control of visually guided grasping. Neuroscientist. 2008;14:157–170. - PubMed
    1. Fluet MC, Baumann MA, Scherberger H. Context-specific grasp movement representation in macaque ventral premotor cortex. J Neurosci. 2010;30:15175–15184. - PMC - PubMed
    1. Fogassi L, Gallese V, Buccino G, Craighero L, Fadiga L, Rizzolatti G. Cortical mechanism for the visual guidance of hand grasping movements in the monkey: a reversible inactivation study. Brain. 2001;124:571–586. - PubMed

Publication types

LinkOut - more resources