

Age-related changes in the neurophysiology of language in adults: relationship to regional cortical thinning and white matter microstructure
- PMID: 22933802
- PMCID: PMC3475615
- DOI: 10.1523/JNEUROSCI.0136-12.2012
Age-related changes in the neurophysiology of language in adults: relationship to regional cortical thinning and white matter microstructure
Abstract
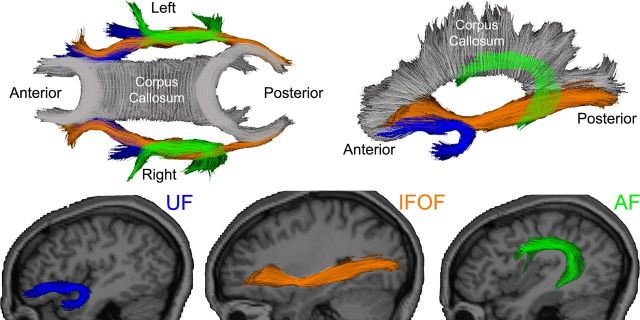
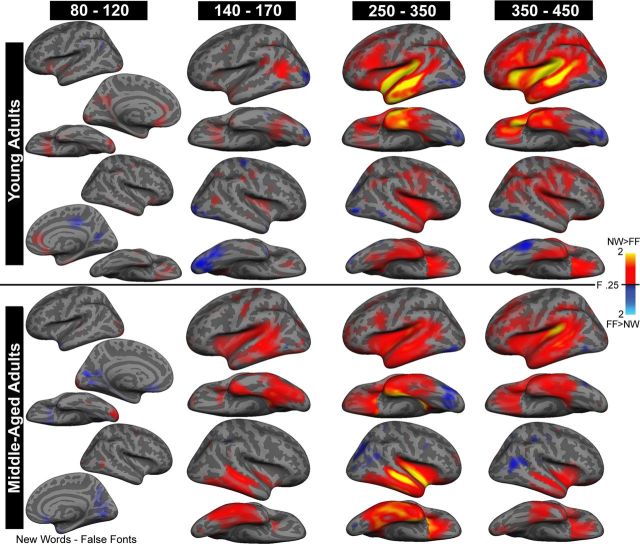
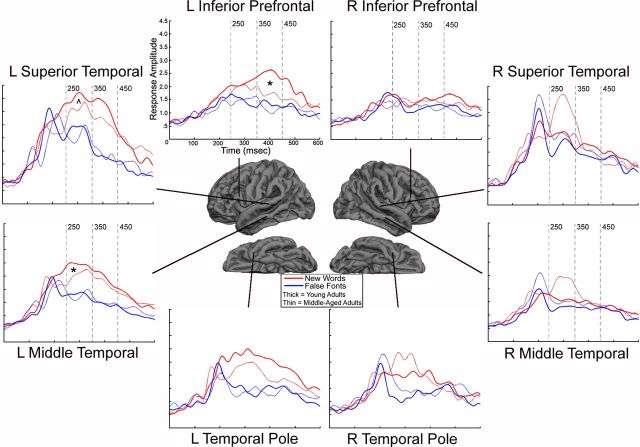
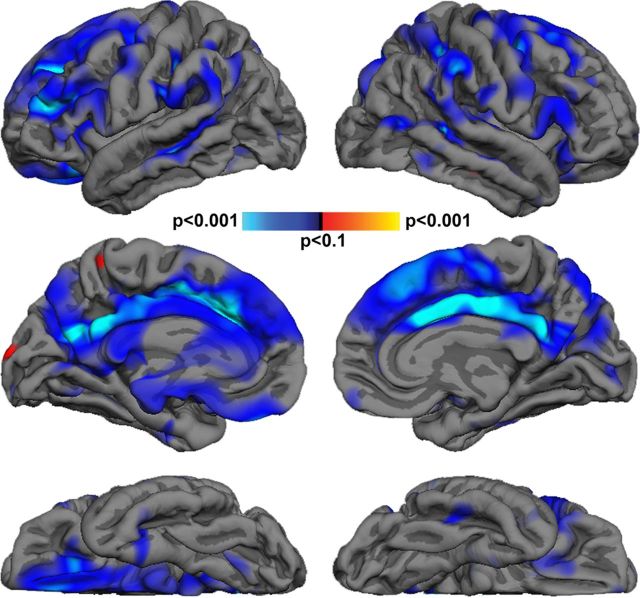
Although reading skill remains relatively stable with advancing age in humans, neurophysiological measures suggest potential reductions in efficiency of lexical information processing. It is unclear whether these age-related changes are secondary to decreases in regional cortical thickness and/or microstructure of fiber tracts essential to language. Magnetoencephalography, volumetric MRI, and diffusion tensor imaging were performed in 10 young (18-33 years) and 10 middle-aged (42-64 years) human individuals to evaluate the spatiotemporal dynamics and structural correlates of age-related changes in lexical-semantic processing. Increasing age was associated with reduced activity in left temporal lobe regions from 250 to 350 ms and in left inferior prefrontal cortex from 350 to 450 ms (i.e., N400). Hierarchical regression indicated that age no longer predicted left inferior prefrontal activity after cortical thickness and fractional anisotropy (FA) of the uncinate fasciculus (UF) were considered. Interestingly, FA of the UF was a stronger predictor of the N400 response than cortical thickness. Age-related reductions in left-lateralization of language responses were observed between 250 and 350 ms, and were associated with left temporal thinning and frontotemporal FA reductions. N400 reductions were not associated with poorer task performance. Rather, increasing age was associated with reduction in the left prefrontal N400, which in turn was also associated with slower response time. These results reveal that changes in the neurophysiology of language occur by middle age and appear to be partially mediated by structural brain loss. These neurophysiological changes may reflect an adaptive process that ensues as communication between left perisylvian regions declines.
Figures
References
-
- Aine CJ, Adair JC, Knoefel JE, Hudson D, Qualls C, Kovacevic S, Woodruff CC, Cobb W, Padilla D, Lee RR, Stephen JM. Temporal dynamics of age-related differences in auditory incidental verbal learning. Brain Res Cogn Brain Res. 2005;24:1–18. - PubMed
-
- Anwander A, Tittgemeyer M, von Cramon DY, Friederici AD, Knösche TR. Connectivity-based parcellation of Broca's area. Cereb Cortex. 2007;17:816–825. - PubMed
-
- Cabeza R, Anderson ND, Locantore JK, McIntosh AR. Aging gracefully: compensatory brain activity in high-performing older adults. Neuroimage. 2002;17:1394–1402. - PubMed
-
- Cabeza R, Daselaar SM, Dolcos F, Prince SE, Budde M, Nyberg L. Task-independent and task-specific age effects on brain activity during working memory, visual attention and episodic retrieval. Cereb Cortex. 2004;14:364–375. - PubMed
Publication types
MeSH terms
Grants and funding
LinkOut - more resources
Full Text Sources
Medical