Image-guided PO2 probe measurements correlated with parametric images derived from 18F-fluoromisonidazole small-animal PET data in rats
- PMID: 22933821
- PMCID: PMC3784982
- DOI: 10.2967/jnumed.112.103523
Image-guided PO2 probe measurements correlated with parametric images derived from 18F-fluoromisonidazole small-animal PET data in rats
Abstract
(18)F-fluoromisonidazole PET, a noninvasive means of identifying hypoxia in tumors, has been widely applied but with mixed results, raising concerns about its accuracy. The objective of this study was to determine whether kinetic analysis of dynamic (18)F-fluoromisonidazole data provides better discrimination of tumor hypoxia than methods based on a simple tissue-to-plasma ratio.
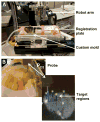
Methods: Eleven Dunning R3327-AT prostate tumor-bearing nude rats were immobilized in custom-fabricated whole-body molds, injected intravenously with (18)F-fluoromisonidazole, and imaged dynamically for 105 min. They were then transferred to a robotic system for image-guided measurement of intratumoral partial pressure of oxygen (Po(2)). The dynamic (18)F-fluoromisonidazole uptake data were fitted with 2 variants of a 2-compartment, 3-rate-constant model, one constrained to have K(1) equal to k(2) and the other unconstrained. Parametric images of the rate constants were generated. The Po(2) measurements were compared with spatially registered maps of kinetic rate constants and tumor-to-plasma ratios.
Results: The constrained pharmacokinetic model variant was shown to provide fits similar to that of the unconstrained model and did not introduce significant bias in the results. The trapping rate constant, k(3), of the constrained model provided a better discrimination of low Po(2) than the tissue-to-plasma ratio or the k(3) of the unconstrained model.
Conclusion: The use of kinetic modeling on a voxelwise basis can identify tumor hypoxia with improved accuracy over simple tumor-to-plasma ratios. An effective means of controlling noise in the trapping rate constant, k(3), without introducing significant bias, is to constrain K(1) equal to k(2) during the fitting process.
Conflict of interest statement
No other potential conflict of interest relevant to this article was reported.
Figures


References
-
- Brizel DM, Scully SP, Harrelson JM, et al. Tumor oxygenation predicts for the likelihood of distant metastases in human soft tissue sarcoma. Cancer Res. 1996;56:941–943. - PubMed
-
- Hockel M, Schlenger K, Aral B, Mitze M, Schaffer U, Vaupel P. Association between tumor hypoxia and malignant progression in advanced cancer of the uterine cervix. Cancer Res. 1996;56:4509–4515. - PubMed
-
- Mottram JC. A factor of importance in the radio-sensitivity of tumours. Br J Radiol. 1936;9:606–614.
-
- Teicher BA, Holden SA, al-Achi A, Herman TS. Classification of antineoplastic treatments by their differential toxicity toward putative oxygenated and hypoxic tumor subpopulations in vivo in the FSaIIC murine fibrosarcoma. Cancer Res. 1990;50:3339–3344. - PubMed
-
- Nozue M, Lee I, Yuan F, et al. Interlaboratory variation in oxygen tension measurement by Eppendorf “Histograph” and comparison with hypoxic marker. J Surg Oncol. 1997;66:30–38. - PubMed
Publication types
MeSH terms
Substances
Grants and funding
LinkOut - more resources
Full Text Sources
Other Literature Sources
