. 2012:2012:102954.
doi: 10.1155/2012/102954. Epub 2012 Aug 13.

A role of fluoride on free radical generation and oxidative stress in BV-2 microglia cells

Affiliations

A role of fluoride on free radical generation and oxidative stress in BV-2 microglia cells

Xi Shuhua et al. Mediators Inflamm. 2012.

Abstract

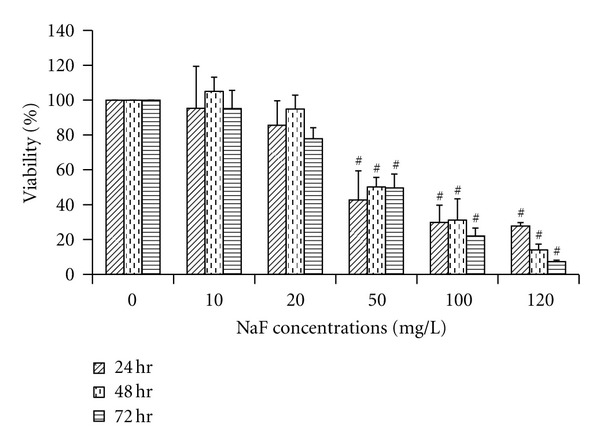
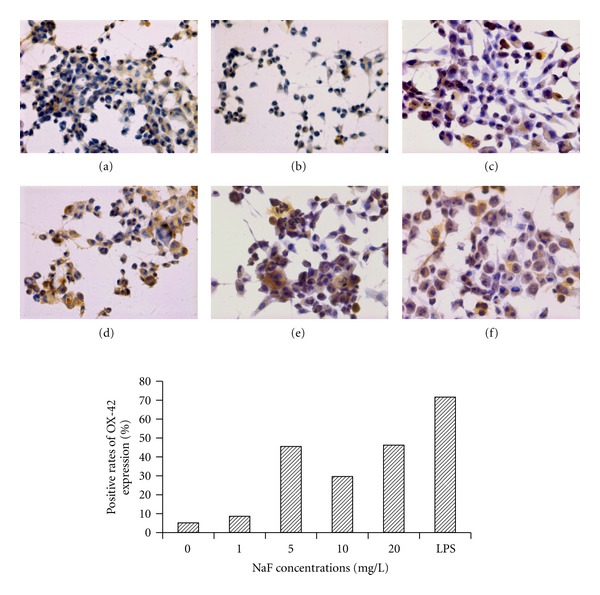
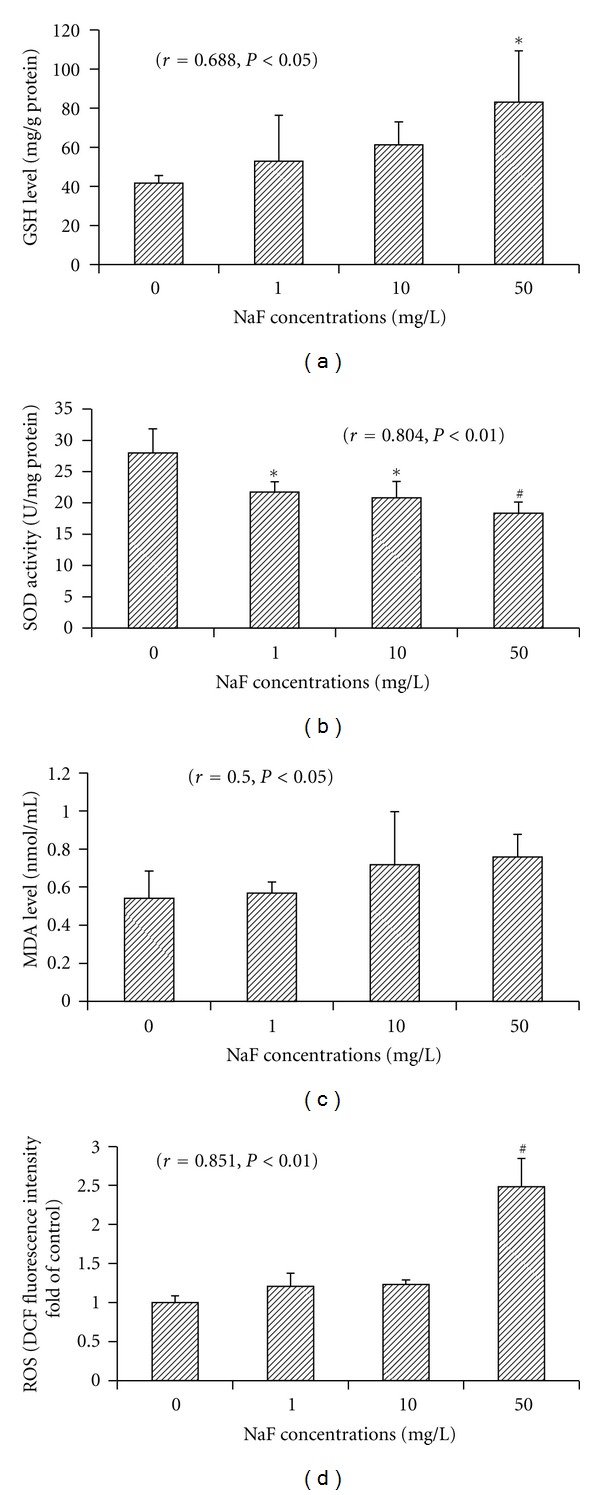
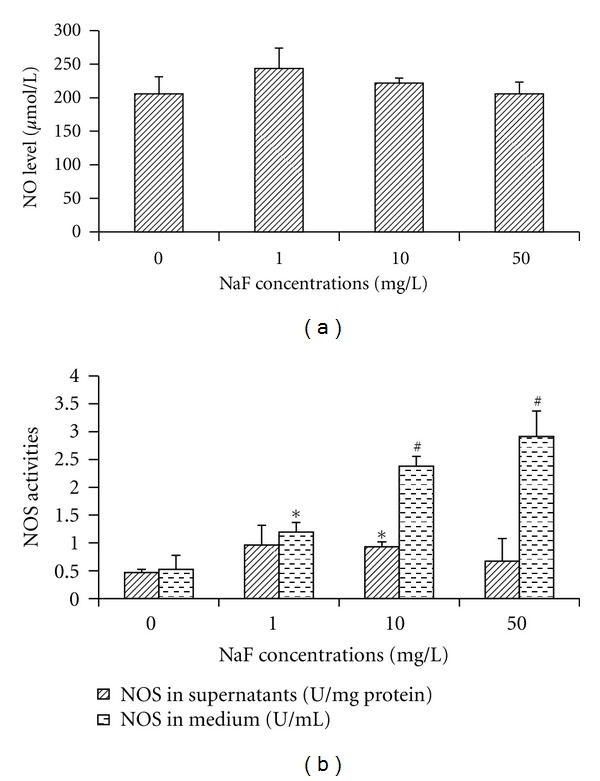
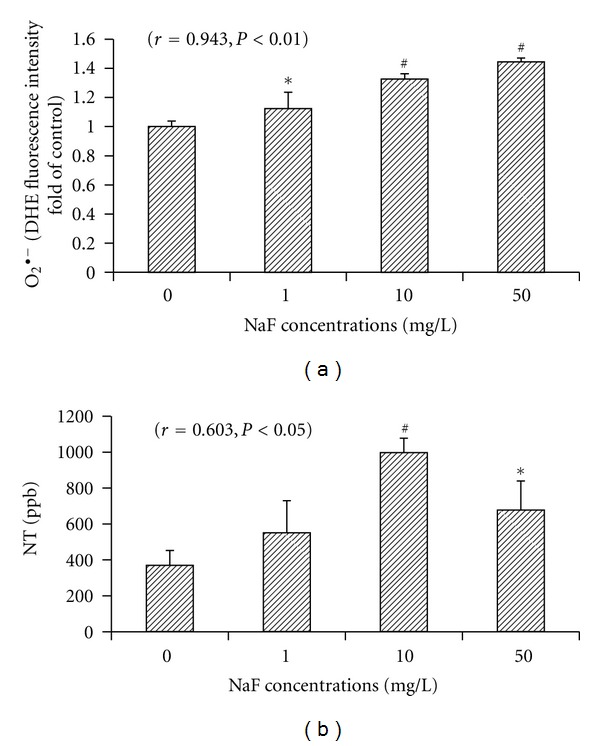
The generation of ROS and lipid peroxidation has been considered to play an important role in the pathogenesis of chronic fluoride toxicity. In the present study, we observed that fluoride activated BV-2 microglia cell line by observing OX-42 expression in immunocytochemistry. Intracellular superoxide dismutase (SOD), glutathione (GSH), malondialdehyde (MDA), reactive oxygen species (ROS), superoxide anions (O(2)(∙-)), nitric oxide synthase (NOS), nitrotyrosine (NT) and nitric oxide (NO), NOS in cell medium were determined for oxidative stress assessment. Our study found that NaF of concentration from 5 to 20 mg/L can stimuli BV-2 cells to change into activated microglia displaying upregulated OX-42 expression. SOD activities significantly decreased in fluoride-treated BV-2 cells as compared with control, and MDA concentrations and contents of ROS and O(2)(∙-) increased in NaF-treated cells. Activities of NOS in cells and medium significantly increased with fluoride concentrations in a dose-dependent manner. NT concentrations also increased significantly in 10 and 50 mg/L NaF-treated cells compared with the control cells. Our present study demonstrated that toxic effects of fluoride on the central nervous system possibly partly ascribed to activiting of microglia, which enhanced oxidative stress induced by ROS and reactive nitrogen species.


Figures

Figure 1
Figure 1
Effects of fluoride on cell viability in microglial BV-2 cells. Cells were treated with various concentrations of NaF and incubated for 24, 48, and 72 h. Cell viabilities were measured using MTT assay, and data were presented as a percentage of the control. # P < 0.01 compared to the control group.
Figure 2
Figure 2
The activity of microglial BV-2 cells induced by fluoride. Cells were treated with indicated concentrations of NaF for 24 h and immunocytochemistry localization with an OX-42 antibody as a microglial marker were observed. Microglial activity was detected by OX-42 expression, and the microglia cells treated with LPS were used as a positive control. Morphological changes of microglia from the resting state ((a) small cell bodies and thin, long, or ramified processes) to the activated state ((c), (d), (e), (f) larger cell bodies with short, thick) were observed after fluoride or LPS treatment in the BV-2 cells. High expression areas of OX-42 immunoreactivity were indicated by arrows. Optic microscopy: HE (400×). (a) control, (b) 1 mg/L NaF, (c) 5 mg/L NaF, (d) 10 mg/L NaF, (e) 20 mg/L NaF, and (f) 100 ng/mL LPS.
Figure 3
Figure 3
Effects of fluoride on intracellular GSH levels (a); SOD activity (b); LPO production (MDA) (c) and ROS production (d) in microglial BV-2 cells. After the cells were treated with various concentrations of NaF (1, 10, and 50 mg/L) for 24 h, the contents of GSH, MDA and the activities of SOD were measured using commercial test kits. DCF fluorescence intensity was measured by flow cytometry for ROS content and DCF fluorescence intensity fold of control was analyzed. Bars were presented as mean ± SD. *P < 0.05 and # P < 0.01 compared to the control group.
Figure 4
Figure 4
Effects of fluoride on NO production (a), and NOS activities (b) in microglial BV-2 cells. After the cells were treated with various concentrations of NaF (1, 10, and 50 mg/L) for 24 h, NO release in culture medium and NOS activities in supernatants and medium were measured using commercial test kits. Bars were presented as mean ± SD. *P < 0.05 and # P < 0.01 compared to the control group.
Figure 5
Figure 5
Effects of fluoride on O2 ∙− production (a) and NT concentrations (b) in microglial BV-2 cells. BV-2cells were treated with various concentrations of NaF (1, 10, and 50 mg/L) for a 24 h incubation period, and DHE fluorescence intensity was measured by flow cytometry for O2 ∙− content and DHE fluorescence intensity fold of control was analyzed. Intracellular NT concentrations were measured by ELISA. Bars were presented as mean ± SD. *P < 0.05 and # P < 0.01 compared to the control group.

References

    1. Chachra D, Vieira APGF, Grynpas MD. Fluoride and mineralized tissues. Critical Reviews in Biomedical Engineering. 2008;36(2-3):183–223. - PubMed
    1. Ozsvath DL. Fluoride and environmental health: a review. Reviews in Environmental Science and Biotechnology. 2009;8(1):59–79.
    1. Lu Y, Sun ZR, Wu LN, Wang X, Lu W, Liu SS. Effect of high-fluoride water on intelligence in children. Fluoride. 2000;33(2):74–78.
    1. Zhao LB, Liang GH, Zhang DN, Wu XR. Effect of a high fluoride water supply on children’s intelligence. Fluoride. 1996;29(4):190–192.
    1. Li XS, Zhi JL, Gao RO. Effect of fluoride exposure on intelligence in children. Fluoride. 1995;28(4):189–192.

Publication types