. 2012 Jul 20:3:266.
doi: 10.3389/fphys.2012.00266. eCollection 2012.

An integrated fluid-chemical model toward modeling the formation of intra-luminal thrombus in abdominal aortic aneurysms

Affiliations

An integrated fluid-chemical model toward modeling the formation of intra-luminal thrombus in abdominal aortic aneurysms

Jacopo Biasetti et al. Front Physiol. .

Abstract

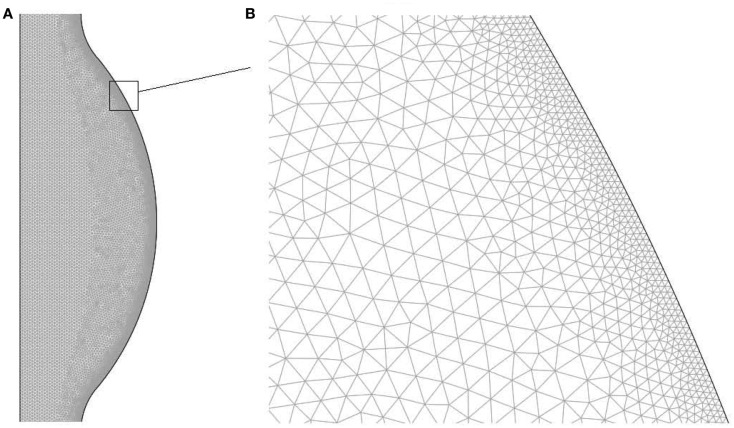
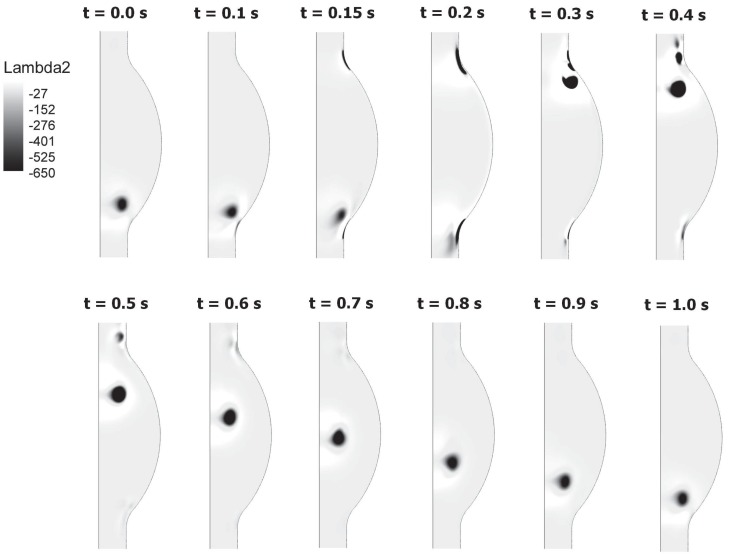
Abdominal Aortic Aneurysms (AAAs) are frequently characterized by the presence of an Intra-Luminal Thrombus (ILT) known to influence their evolution biochemically and biomechanically. The ILT progression mechanism is still unclear and little is known regarding the impact of the chemical species transported by blood flow on this mechanism. Chemical agonists and antagonists of platelets activation, aggregation, and adhesion and the proteins involved in the coagulation cascade (CC) may play an important role in ILT development. Starting from this assumption, the evolution of chemical species involved in the CC, their relation to coherent vortical structures (VSs) and their possible effect on ILT evolution have been studied. To this end a fluid-chemical model that simulates the CC through a series of convection-diffusion-reaction (CDR) equations has been developed. The model involves plasma-phase and surface-bound enzymes and zymogens, and includes both plasma-phase and membrane-phase reactions. Blood is modeled as a non-Newtonian incompressible fluid. VSs convect thrombin in the domain and lead to the high concentration observed in the distal portion of the AAA. This finding is in line with the clinical observations showing that the thickest ILT is usually seen in the distal AAA region. The proposed model, due to its ability to couple the fluid and chemical domains, provides an integrated mechanochemical picture that potentially could help unveil mechanisms of ILT formation and development.

Keywords: abdominal aortic aneurysm; coagulation cascade; computational fluid dynamics; convection-diffusion-reaction equations; intra-luminal thrombus; platelets; thrombin; vortical structures.


Figures

Figure 1
Figure 1
Axisymmetric fusiform abdominal aortic aneurysm (AAA) of 4.4 cm in (luminal) diameter with the dotted line denoting the axis of symmetry. Two cases of exposed subendothelium were introduced: Case (A) considers a large exposure and Case (B) a focal exposure, see also Section 2.2.3.
Figure 2
Figure 2
Finite element mesh used to solve the fluid dynamical and chemical set of equations: (A) bulge region, (B) zoom of the near wall region.
Figure 3
Figure 3
(A) Initiation of the CC at sites of subendothelial exposure, i.e., when extravascular tissue factor (TF) binds with blood-borne factor VIIa. (B) CC: subendothelial exposure triggers thrombin formation via the extrinsic (Tissue Factor, TF) pathway. Positive feedback (denoted by the dotted arrow) of the intrinsic pathway increases thrombin formation. The reaction from prothrombin to thrombin formally belongs to the common pathway, here indicated by the oval.
Figure 4
Figure 4
Peclet number contours for the CDR problem at peak systole (t = 0.25 s) and late diastole (t = 1.00 s). In both cases the Peclet number is much larger than one in the whole domain, thus requiring numerical stabilization.
Figure 5
Figure 5
Evolution of species’ concentrations in the CC model. Thrombin production shows three distinct phases, i.e., time-lag, accelerated, and plateau phases. The concentrations of some chemical species are too low to be seen in the figure.
Figure 6
Figure 6
Vorticity magnitude (s−1) (first row) and Vortical Structures (VSs), educed with the λ2-method (s−2), (second row) dynamics at three selected times t in the cardiac cycle. The sequence highlights the formation process of the VSs (VS1 and VS2) as a result of the vorticity sheet separation and roll-up (details in the text).
Figure 7
Figure 7
Birth and evolution of Vortical Structures (VSs) at different times t throughout the cardiac cycle. A vortex sheet formed at the proximal end of the AAA (t = 0.15–0.2 s) develops in a vortex (VS1) rotating counter-clockwise (t = 0.3 s). The vortex moves downward until it impinges on the distal contraction of the AAA. The genesis and motion of the second vortex (VS2) is also visible.
Figure 8
Figure 8
Mechanism of VS-induced wall-vorticity accumulation and Vortical Structures (VSs) detachment. The main VS (VS1), superimposed on a main flow directed from left to right, induces a velocity field in the near wall region which accumulates vorticity forming another VS (VS2) and, subsequently, promotes its detachment.
Figure 9
Figure 9
Spatially averaged wall shear stress (AWSS) in the distal contraction during the cardiac cycle. During Vortical Structures (VSs) impingement (between t = 0.15 s and t = 0.4 s) the averaged WSS increases more than four times with respect to the diastolic values.
Figure 10
Figure 10
Thrombin (IIa) distribution once the periodic state is reached in the two investigated cases. Considering a large [Case (A)] and a small [Case (B)] subendothelial exposure (see Section 2.1) both concentration patterns are strongly shifted toward the distal Abdominal Aortic Aneurysm (AAA) region. A larger area of high thrombin concentration is found in Case (A) due to the larger endothelial damage.
Figure 11
Figure 11
Vortical Structures (VSs) educed with the λ2-method (left) and thrombin (IIa) distribution (right) at time t = 0.4 s during the cardiac cycle. The thrombin distribution is shown using a logarithmic scale. As clearly shown, the moving VS is carrying thrombin and the characteristic counter-clockwise trail is due to the counter-clockwise rotation of the VS.
Figure 12
Figure 12
ILT thickness measured on slices perpendicular to the centerline from 61 patients with small AAAs (<5.5 cm). Dots and bars denote the median and the lower and upper quartile respectively. The thickest ILT is located in the distal region of the aneurysm, at around 70% of its length starting from the renal arteries. Further details are given in Martufi et al. (submitted).

References

    1. Abraham F., Behr M., Heinkenschloss M. (2005). Shape optimization in steady blood flow: a numerical study of non-Newtonian effects. Comput. Methods Biomech. Biomed. Engin. 8, 127–13710.1080/10255840500309562 - DOI - PubMed
    1. Acheson D. J. (2003). Elementary Fluid Dynamics. Oxford University Press
    1. Ambrose J. A., Almeida O. D., Sharma S. K., Ratner D. G. (1997). Angiographic evolution of intra-coronary thrombus and dissection following percutaneous transluminal coronary angioplasty (the Thrombolysis and Angioplasty in Unstable Angina [TAUSA] trial). Am. J. Cardiol. 79, 559–56310.1016/S0002-9149(96)00815-6 - DOI - PubMed
    1. Antoniak S., Boltzen U., Eisenreich A., Stellbaum C., Poller W., Schultheiss H. P., Rauch U. (2009). Regulation of cardiomyocyte full-length tissue-factor expression and microparticles release under inflammatory conditions in vitro. J. Thromb. Haemost. 7, 871–87810.1111/j.1538-7836.2009.03323.x - DOI - PubMed
    1. Basmadjian D., Sefton M. V., Baldwin S. A. (1997). Coagulation on biomaterials in flowing blood: some theoretical considerations. Biomaterials 18, 1511–152210.1016/S0142-9612(97)00101-4 - DOI - PubMed

LinkOut - more resources