. 2012 Aug 6:3:299.
doi: 10.3389/fphys.2012.00299. eCollection 2012.

Integration of expression data in genome-scale metabolic network reconstructions

Affiliations

Integration of expression data in genome-scale metabolic network reconstructions

Anna S Blazier et al. Front Physiol. .

Abstract

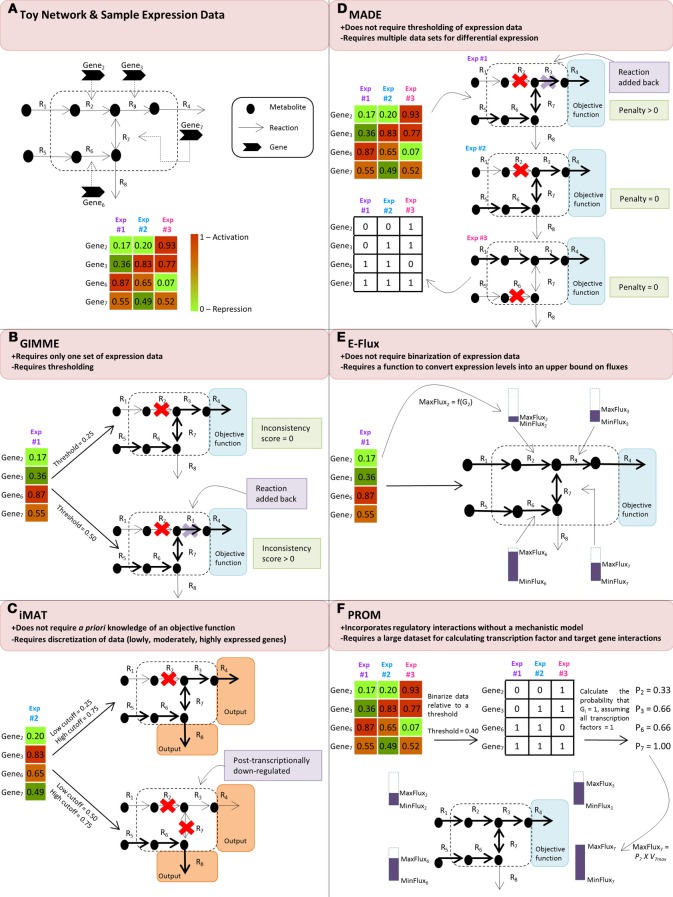
With the advent of high-throughput technologies, the field of systems biology has amassed an abundance of "omics" data, quantifying thousands of cellular components across a variety of scales, ranging from mRNA transcript levels to metabolite quantities. Methods are needed to not only integrate this omics data but to also use this data to heighten the predictive capabilities of computational models. Several recent studies have successfully demonstrated how flux balance analysis (FBA), a constraint-based modeling approach, can be used to integrate transcriptomic data into genome-scale metabolic network reconstructions to generate predictive computational models. In this review, we summarize such FBA-based methods for integrating expression data into genome-scale metabolic network reconstructions, highlighting their advantages as well as their limitations.

Keywords: data integration; expression data; flux balance analysis; metabolic networks; transcriptomics.


Figures

Figure 1
Figure 1
(A) Toy network and sample expression data for three different experimental conditions. Panels (B), (C), (D), (E) and (F) demonstrate how the discussed algorithms use the sample expression data to modify the flow of reaction flux, shown in the boldness of the reaction arrow, through the toy network. (B) GIMME compares the expression data to a threshold and subsequently removes reactions whose expression levels fall below the threshold. In the second case where the threshold is 0.50, the removal of R3 causes the network to not achieve its user-specified objective function, resulting in a non-functional model; thus, it is added back into the network to create a functional model. (C) iMAT discretizes the expression data into lowly, moderately, and highly expressed reaction sets and removes reactions that are lowly expressed from the network. Because the network is not required to achieve a specified objective function, both cases of thresholding result in a functional model. However, in the second case where the low cutoff is 0.50 and the high cutoff is 0.75, R3 is considered to be post-transcriptionally down-regulated because, even though expression data shows it to be highly expressed, the resulting toy network indicates that R3 has little, if any, reaction flux. (D) MADE determines a sequence of binary expression states by maximizing the statistically significant changes across the expression states and simultaneously solves the flux balance analysis problem for each of the experimental conditions, resulting in unique toy networks for each condition. (E) E-Flux uses the expression data to modify the maximum possible flux, MaxFluxi, through the relevant reactions. (F) PROM first binarizes the data according to a threshold to determine on/off states and then determines the probability that a gene is on when its transcription factor is also on. In this example, we assume that the transcription factors are on for all of the genes. Using this probability, PROM modifies the MaxFluxi through the relevant reactions.

References

    1. Akesson M., Forster J., Nielsen J. (2004). Integration of gene expression data into genome-scale metabolic models. Metab. Eng. 6, 285–293 10.1016/j.ymben.2003.12.002 - DOI - PubMed
    1. Becker S. A., Palsson B. O. (2008). Context-specific metabolic networks are consistent with experiments. PLoS Comput. Biol. 4:e1000082 10.1371/journal.pcbi.1000082 - DOI - PMC - PubMed
    1. Cakir T., Patil K. R., Onsan Z. I., Ulgen K. O., Kirdar B., Nielsen J. (2006). Integration of metabolome data with metabolic networks reveals reporter reactions. Mol. Syst. Biol. 2, 1–11 10.1038/msb4100085 - DOI - PMC - PubMed
    1. Chandrasekaran S., Price N. D. (2010). Probabilistic integrative modeling of genome-scale metabolic and regulatory networks in Escherichia coli and Mycobacterium tuberculosis. Proc. Natl. Acad. Sci. U.S.A. 107, 17845–17850 10.1073/pnas.1005139107 - DOI - PMC - PubMed
    1. Chang R. L., Ghamsari L., Manichaikul A., Hom E. F., Balaji S., Fu W., Shen Y., Hao T., Palsson B. O., Salehi-Ashtiani K., Papin J. A. (2011). Metabolic network reconstruction of Chlamydomonas offers insight into light-driven algal metabolism. Mol. Syst. Biol. 7, 1–13 10.1038/msb.2011.52 - DOI - PMC - PubMed

LinkOut - more resources