

doi: 10.3389/fphys.2012.00305.
eCollection 2012.
Phenotyping maize for adaptation to drought
Affiliations
- PMID: 22934056
- PMCID: PMC3429076
- DOI: 10.3389/fphys.2012.00305
Item in Clipboard
Phenotyping maize for adaptation to drought
Front Physiol.
.
Abstract
The need of a better adaptation of crops to drought is an issue of increasing urgency. However, enhancing the tolerance of maize has, therefore, proved to be somewhat elusive in terms of plant breeding. In that context, proper phenotyping remains as one of the main factors limiting breeding advance. Topics covered by this review include the conceptual framework for identifying secondary traits associated with yield response to drought and how to measure these secondary traits in practice.
Keywords: breeding; drought; maize; phenotyping; yield.
Figures

Relationship between yield loss per day of stress and growth stage in a maize hybrid bred in the 1960s (Redrawn from Shaw, 1977).
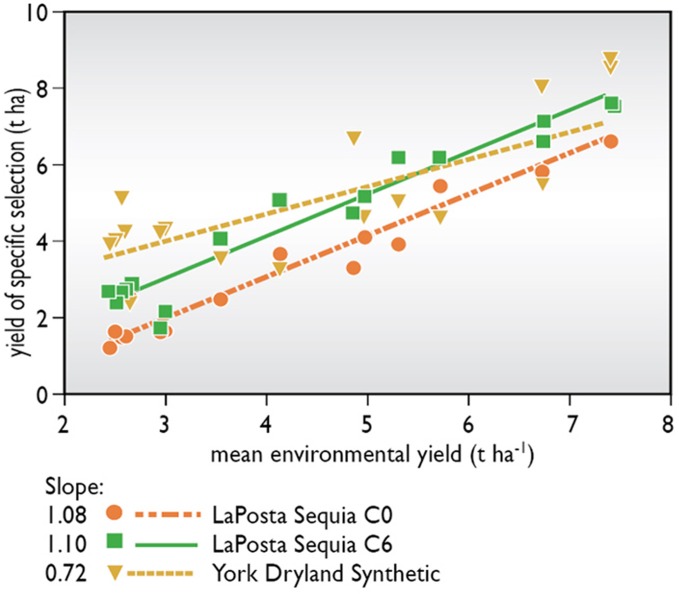
Yield of unselected and selected versions of a tropical population, “La Posta Sequia,” when grown in environments to which it was not adapted. Yields of an adapted Corn Belt population, “York Dryland Synthetic,” are given as reference.
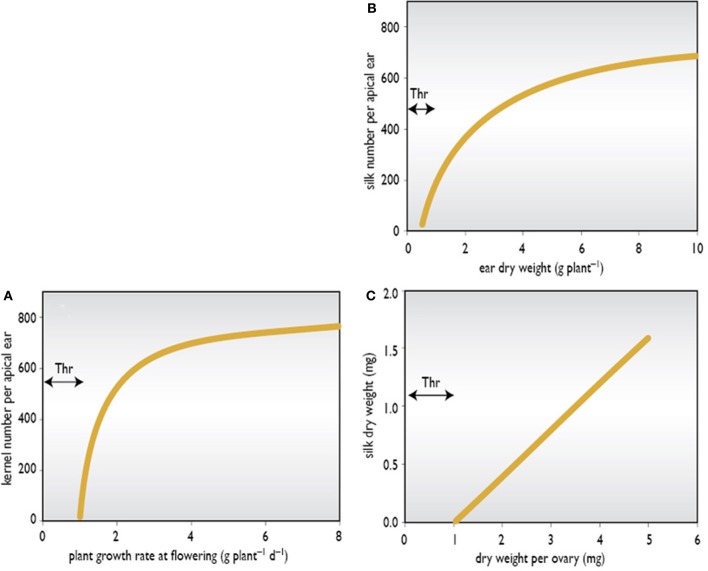
Theoretical thresholds (Thr) in ear growth. (A) Kernel number versus plant growth rate at flowering; (B) Silk number versus ear dry weight; and (C) Silk dry weight versus ovary dry weight.
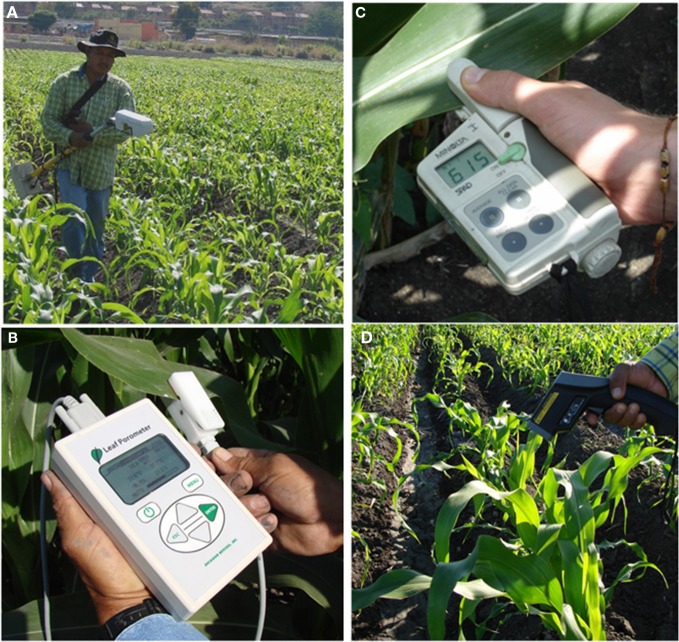
Different devices to evaluate plant growth, phenology and water status. (A) spectroradiometer with active sensor to measure the normalized difference vegetation index (NDVI); (B) porometer to measure stomatal conductance; (C) leaf chlorophyll meter; (D) infrared thermometer to measure leaf temperature.
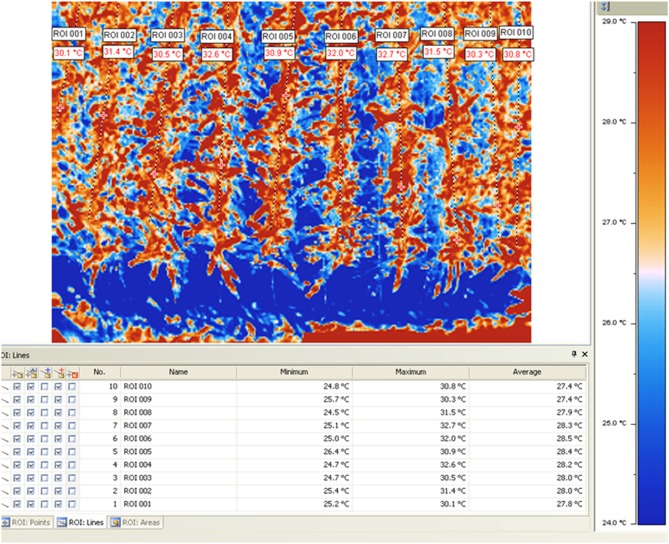
Thermal image and corresponding temperatures of different maize testcrosses measured at CIMMYT's experimental station of Tlaltizapan (Ed. Morelos, Mexico). For more information about the procedure used see Romano et al., and Zia et al., .

Relationship between biomass per plant about 2 weeks after anthesis with (A) oxygen isotope composition in mature kernels (δ18O) and (B) ash concentration in leaves about 2 weeks after anthesis. Data from a set of maize inbred lines and derived hybrids grown under three different water regimes were plotted together (n = 96). Each point represents a mean value for three plots of a single genotype grown under a particular water regime (Redrawn from Araus et al., 2010).
References
-
- Anderson S. R., Lauer M. J., Schoper J. B., Shibles R. M. (2004). Pollination timing effects on kernel set and silk receptivity in four maize hybrids. Crop Sci. 44, 464–473
-
- Andrade F. H., Cirilo A., Uhart S., Otegui M. E. (1996). Ecofisiología del Cultivo de Maíz. Buenos Aires, Argentina: DeKalb Press, 290
-
- Aparicio N., Villegas D., Casadesús J., Araus J. L., Royo C. (2000). Spectral reflectance indices for assessing durum wheat biomass, green area, and yield under Mediterranean conditions. Agron. J. 92, 83–91
-
- Araus J. L., Amaro T., Casadesús J., Asbati A., Nachit M. M. (1998). Relationships between ash content, carbon isotope discrimination and yield in durum wheat. Aust. J. Plant Physiol. 25, 835–842
LinkOut - more resources
Full Text Sources
Other Literature Sources