. 2012 Aug 23:3:337.
doi: 10.3389/fphys.2012.00337. eCollection 2012.

Period2 gene mutant mice show compromised insulin-mediated endothelial nitric oxide release and altered glucose homeostasis

Affiliations

Period2 gene mutant mice show compromised insulin-mediated endothelial nitric oxide release and altered glucose homeostasis

João M Carvas et al. Front Physiol. .

Abstract

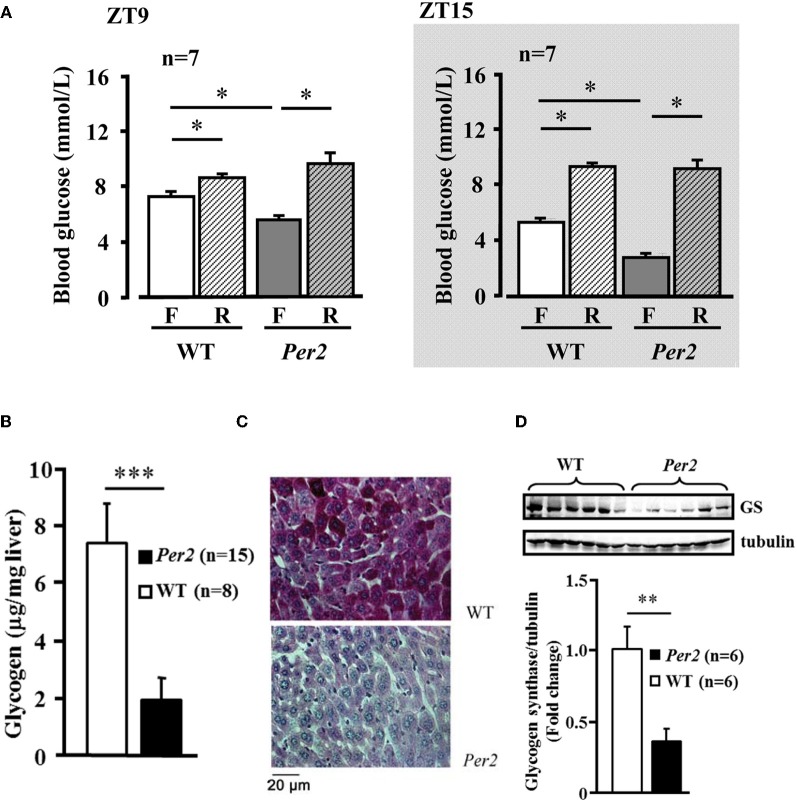
Period2 (Per2) is an important component of the circadian clock. Mutation of this gene is associated with vascular endothelial dysfunction and altered glucose metabolism. The aim of this study is to further characterize whole body glucose homeostasis and endothelial nitric oxide (NO) production in response to insulin in the mPer2(Brdm1) mice. We show that mPer2(Brdm1) mice exhibit compromised insulin receptor activation and Akt signaling in various tissues including liver, fat, heart, and aortas with a tissue-specific heterogeneous diurnal pattern, and decreased insulin-stimulated NO release in the aortas in both active and inactive phases of the animals. As compared to wild type (WT) mice, the mPer2(Brdm1) mice reveal hyperinsulinemia, hypoglycemia with lower fasting hepatic glycogen content and glycogen synthase level, no difference in glucose tolerance and insulin tolerance. The mPer2(Brdm1) mice do not show increased predisposition to obesity either on normal chow or high fat diet compared to WT controls. Thus, mice with Per2 gene mutation show altered glucose homeostasis and compromised insulin-stimulated NO release, independently of obesity.

Keywords: blood vessel; circadian gene; glucose; glycogen; insulin; nitric oxide; obesity; signaling.


Figures

Figure 1
Figure 1
Compromised insulin receptor activation in response to insulin in the liver (A), epididymal adipose tissue (B), heart (C), and aortas (D) of mPer2Brdm1 mice. Representative immunoblotting and respective quantifications of insulin receptor β subunit phosphorylations (Y1162/1163) upon intraperitoneal injection of insulin (0.5 mU/g body weight, 5 min) at ZT9 and ZT15, respectively (n = 4−8). *p < 0.05 between indicated groups. Aortas are stimulated by insulin (100 nmol/L, 5 min) ex vivo at ZT9 and ZT15. The symbol “−” or “+” means without or with insulin stimulation, respectively. * = p < 0.05 and **p < 0.01 between the indicated groups.
Figure 2
Figure 2
Compromised Akt activation in response to insulin in the liver (A), epididymal adipose tissue (B), and heart (C) of mPer2Brdm1 mice. Representative immunoblotting and respective quantifications of Akt-S473 phosphorylation upon intraperitoneal injection of insulin (0.5 mU/g body weight, 5 min) at ZT9 and ZT15 (n = 7−10), respectively. The symbol “−” or “+” means without or with insulin stimulation, respectively. *p < 0.05 and **p < 0.01 between the indicated groups.
Figure 3
Figure 3
Impaired aortic Akt activation and NO release in response to insulin in mPer2Brdm1 mice. (A and B) Representative immunoblotting and respective quantifications of Akt-S473 phosphorylation stimulated by insulin (100 nmol/L, 5 or 20 min as indicated) at ZT9 and ZT15, respectively, in aortas of WT and mPer2Brdm1 mice. (C and D) Confocal microscopic analysis of insulin-stimulated NO production in aortic endothelial layer measured by en face DAF-2DA staining followed by DAPI nucleus counterstaining at ZT9 and ZT15, respectively. The bar graph in the right panel shows the respective quantification of NO signals. Results are presented as ratio of DAF-2DA fluorescence intensity to DAPI (n = 4). * = p < 0.05 between the indicated groups. The symbol “−” or “+” means without or with insulin stimulation, respectively. Bar = 200 μm.
Figure 4
Figure 4
Decreased fasting plasma glucose concentration and hepatic glycogen content in mPer2Brdm1 mice. (A) Decreased fasting (F) blood plasma glucose concentration in the mPer2Brdm1 mice as compared to WT littermates at ZT9 and ZT15, which is normalized after refeeding (R). (B) Fasting hepatic glycogen content of WT and mPer2Brdm1 mice at ZT9. (C) Representative Periodic Acid-Schiff (PAS) staining showing hepatic glycogen contents in WT and mPer2Brdm1 mice. (D) Immunoblotting showing fasting hepatic glycogen synthase (GS) levels in WT and mPer2Brdm1 mice. *p < 0.05, **p < 0.01, and ***p < 0.005 between the indicated groups, respectively.
Figure 5
Figure 5
GTT, ITT test, and basal plasma insulin concentration in mPer2Brdm1 mice. (A) Glucose tolerance test, (B) insulin tolerance test, and (C) basal fasting plasma insulin levels in the mPer2Brdm1 and WT mice at ZT9 and ZT15 (one blood sample from a WT mouse was lost during preparation); *p < 0.05 and **p < 0.01, and ***p < 0.005 vs. mPer2Brdm1 mice.
Figure 6
Figure 6
Body weight development and diet-induced obesity of wild type (WT) and mPer2Brdm1 mice. (A) Comparable body weight development on chow diet and (B) obesity on high fat diet (HFD) feeding between WT and mPer2Brdm1 mice, and (C) qRT-PCR shows no significant difference in adipose tissue inflammation markers.

References

    1. Albrecht U. (2004). The mammalian circadian clock: a network of gene expression. Front. Biosci. 9, 48–55 10.2741/1196 - DOI - PubMed
    1. Anea C. B., Zhang M., Stepp D. W., Simkins G. B., Reed G., Fulton D. J., Rudic R. D. (2009). Vascular disease in mice with a dysfunctional circadian clock. Circulation 119, 1510–1517 10.1161/CIRCULATIONAHA.108.827477 - DOI - PMC - PubMed
    1. Bornfeldt K. E., Tabas I. (2011). Insulin resistance, hyperglycemia, and atherosclerosis. Cell Metab. 14, 575–585 10.1016/j.cmet.2011.07.015 - DOI - PMC - PubMed
    1. Cohen M. C., Rohtla K. M., Lavery C. E., Muller J. E., Mittleman M. A. (1997). Meta-analysis of the morning excess of acute myocardial infarction and sudden cardiac death. Am. J. Cardiol. 79, 1512–1516 - PubMed
    1. Feillet C. A., Ripperger J. A., Magnone M. C., Dulloo A., Albrecht U., Challet E. (2006). Lack of food anticipation in Per2 mutant mice. Curr. Biol. 16, 2016–2022 10.1016/j.cub.2006.08.053 - DOI - PubMed