Correlated discharges in the primate prefrontal cortex before and after working memory training
- PMID: 22934919
- PMCID: PMC3514567
- DOI: 10.1111/j.1460-9568.2012.08267.x
Correlated discharges in the primate prefrontal cortex before and after working memory training
Abstract
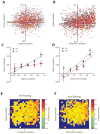
The correlation of discharges between single neurons can provide information about the computations and network properties of neuronal populations during the performance of cognitive tasks. In recent years, dynamic modulation of neuronal correlations by attention has been revealed during the execution of behavioral tasks. Much less is known about the influence of learning and performing a task itself. We therefore sought to quantify the correlated firing of simultaneously recorded pairs of neurons in the prefrontal cortex of naïve monkeys that were only required to fixate, and to examine how this correlation was altered after they had learned to perform a working memory task. We found that the trial-to-trial correlation of discharge rates between pairs of neurons (noise correlation) differed across neurons depending on their responsiveness and selectivity for stimuli, even before training in a working memory task. After monkeys had learned to perform the task, correlated firing decreased overall, although the effects varied according to the functional properties of the neurons. The greatest decreases were observed on comparison of populations of neurons that exhibited elevated firing rates during the trial events and those that had more similar spatial and temporal tuning. Greater decreases in noise correlation were also observed for pairs comprising one fast spiking neuron (putative interneuron) and one regular spiking neuron (putative pyramidal neuron) than pairs comprising regular spiking neurons only. Our results demonstrate that learning and performance of a cognitive task alters the correlation structure of neuronal firing in the prefrontal cortex.
© 2012 The Authors. European Journal of Neuroscience © 2012 Federation of European Neuroscience Societies and Blackwell Publishing Ltd.
Figures


Similar articles
-
Plasticity of Persistent Activity and Its Constraints.Front Neural Circuits. 2020 May 7;14:15. doi: 10.3389/fncir.2020.00015. eCollection 2020. Front Neural Circuits. 2020. PMID: 32528254 Free PMC article. Review.
-
Functional role of cell classes in monkey prefrontal cortex after learning a working memory task.Commun Biol. 2025 May 6;8(1):703. doi: 10.1038/s42003-025-08142-4. Commun Biol. 2025. PMID: 40328904 Free PMC article.
-
Distributed representations of temporal stimulus associations across regular-firing and fast-spiking neurons in rat medial prefrontal cortex.J Neurophysiol. 2020 Jan 1;123(1):439-450. doi: 10.1152/jn.00565.2019. Epub 2019 Dec 18. J Neurophysiol. 2020. PMID: 31851558 Free PMC article.
-
Changes in prefrontal neuronal activity after learning to perform a spatial working memory task.Cereb Cortex. 2011 Dec;21(12):2722-32. doi: 10.1093/cercor/bhr058. Epub 2011 Apr 28. Cereb Cortex. 2011. PMID: 21527786 Free PMC article.
-
Neural changes after training to perform cognitive tasks.Behav Brain Res. 2013 Mar 15;241:235-43. doi: 10.1016/j.bbr.2012.12.017. Epub 2012 Dec 20. Behav Brain Res. 2013. PMID: 23261872 Free PMC article. Review.
Cited by
-
Emergence of Nonlinear Mixed Selectivity in Prefrontal Cortex after Training.J Neurosci. 2021 Sep 1;41(35):7420-7434. doi: 10.1523/JNEUROSCI.2814-20.2021. Epub 2021 Jul 22. J Neurosci. 2021. PMID: 34301827 Free PMC article.
-
Activating Developmental Reserve Capacity Via Cognitive Training or Non-invasive Brain Stimulation: Potentials for Promoting Fronto-Parietal and Hippocampal-Striatal Network Functions in Old Age.Front Aging Neurosci. 2017 Feb 23;9:33. doi: 10.3389/fnagi.2017.00033. eCollection 2017. Front Aging Neurosci. 2017. PMID: 28280465 Free PMC article. Review.
-
Neuronal Population Encoding of Identity in Primate Prefrontal Cortex.J Neurosci. 2024 Feb 7;44(6):e0703232023. doi: 10.1523/JNEUROSCI.0703-23.2023. J Neurosci. 2024. PMID: 37963766 Free PMC article.
-
Prefrontal cortical plasticity during learning of cognitive tasks.Nat Commun. 2022 Jan 10;13(1):90. doi: 10.1038/s41467-021-27695-6. Nat Commun. 2022. PMID: 35013248 Free PMC article.
-
Plasticity of Persistent Activity and Its Constraints.Front Neural Circuits. 2020 May 7;14:15. doi: 10.3389/fncir.2020.00015. eCollection 2020. Front Neural Circuits. 2020. PMID: 32528254 Free PMC article. Review.
References
-
- Abbott LF, Dayan P. The effect of correlated variability on the accuracy of a population code. Neural Comput. 1999;11:91–101. - PubMed
-
- Averbeck BB, Latham PE, Pouget A. Neural correlations, population coding and computation. Nat Rev Neurosci. 2006;7:358–366. - PubMed
-
- Brody CD. Slow covariations in neuronal resting potentials can lead to artefactually fast cross-correlations in their spike trains. J Neurophysiol. 1998;80:3345–3351. - PubMed
Publication types
MeSH terms
Grants and funding
LinkOut - more resources
Full Text Sources

