Evaluating different fixation protocols for spectral cytopathology, part 2: cultured cells
- PMID: 22935013
- PMCID: PMC3463708
- DOI: 10.1021/ac3017407
Evaluating different fixation protocols for spectral cytopathology, part 2: cultured cells
Abstract
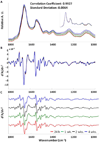
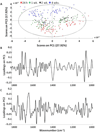
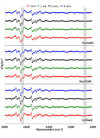
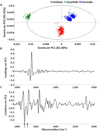
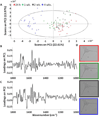
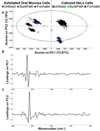
Spectral cytopathology (SCP) is a robust and reproducible diagnostic technique that employs infrared spectroscopy and multivariate statistical methods, such as principal component analysis to interrogate unstained cellular samples and discriminate changes on the biochemical level. In the past decade, SCP has taken considerable strides in its application for disease diagnosis. Cultured cell lines have proven to be useful model systems to provide detailed biological information to this field; however, the effects of sample fixation and storage of cultured cells are still not entirely understood in SCP. Conventional cytopathology utilizes fixation and staining methods that have been established and widely accepted for nearly a century and are focused on maintaining the morphology of a cell. Conversely, SCP practices must implement fixation protocols that preserve the sample's biochemical composition and maintain its spectral integrity so not to introduce spectral changes that may mask variance significant to disease. It is not only necessary to evaluate the effects on fixed exfoliated cells but also fixed cultured cells because although they are similar systems, they exhibit distinct differences. We report efforts to study the effects of fixation methodologies commonly used in traditional cytopathology and SCP including both fixed and unfixed routines applied to cultured HeLa cells, an adherent cervical cancer cell line. Data suggest parallel results to findings in Part 1 of this series for exfoliated cells, where the exposure time in fixative and duration of sample storage via desiccation contribute to minor spectral changes only. The results presented here reinforce observations from Part 1 indicating that changes induced by disease are much greater than changes observed as a result of alternate fixation methodologies. Principal component analysis of HeLa cells fixed via the same conditions and protocols as exfoliated cells (Part 1) yield nearly identical results. More importantly, the overall conclusion is that it is necessary that all samples subjected to comparative analysis should be prepared identically because although changes are minute, they are present.
Figures



Similar articles
-
Evaluating different fixation protocols for spectral cytopathology, part 1.Anal Chem. 2012 Feb 7;84(3):1259-66. doi: 10.1021/ac202046d. Epub 2012 Jan 24. Anal Chem. 2012. PMID: 22103764 Free PMC article.
-
Spectral cytopathology of cervical samples: detecting cellular abnormalities in cytologically normal cells.Lab Invest. 2010 Jul;90(7):1068-77. doi: 10.1038/labinvest.2010.72. Epub 2010 Apr 5. Lab Invest. 2010. PMID: 20368702 Free PMC article.
-
Infrared micro-spectroscopy for cyto-pathological classification of esophageal cells.Analyst. 2015 Apr 7;140(7):2215-23. doi: 10.1039/c4an01884b. Analyst. 2015. PMID: 25594077
-
Cancer screening via infrared spectral cytopathology (SCP): results for the upper respiratory and digestive tracts.Analyst. 2016 Jan 21;141(2):416-28. doi: 10.1039/c5an01751c. Analyst. 2016. PMID: 26421636 Review.
-
Molecular pathology via IR and Raman spectral imaging.J Biophotonics. 2013 Dec;6(11-12):855-86. doi: 10.1002/jbio.201300131. Epub 2013 Nov 4. J Biophotonics. 2013. PMID: 24311233 Review.
Cited by
-
Importance of tissue preparation methods in FTIR micro-spectroscopical analysis of biological tissues: 'traps for new users'.PLoS One. 2015 Feb 24;10(2):e0116491. doi: 10.1371/journal.pone.0116491. eCollection 2015. PLoS One. 2015. PMID: 25710811 Free PMC article.
-
From Research to Diagnostic Application of Raman Spectroscopy in Neurosciences: Past and Perspectives.Free Neuropathol. 2022 Aug 5;3:19. doi: 10.17879/freeneuropathology-2022-4210. eCollection 2022 Jan. Free Neuropathol. 2022. PMID: 37284145 Free PMC article.
-
From Mouse to Human: Comparative Analysis between Grey and White Matter by Synchrotron-Fourier Transformed Infrared Microspectroscopy.Biomolecules. 2020 Jul 24;10(8):1099. doi: 10.3390/biom10081099. Biomolecules. 2020. PMID: 32722088 Free PMC article.
-
Roadmap for Postnatal Brain Maturation: Changes in Gray and White Matter Composition during Development Measured by Fourier Transformed Infrared Microspectroscopy.ACS Chem Neurosci. 2023 Sep 6;14(17):3088-3102. doi: 10.1021/acschemneuro.3c00237. Epub 2023 Aug 4. ACS Chem Neurosci. 2023. PMID: 37540627 Free PMC article.
-
Raman microscopy of bladder cancer cells expressing green fluorescent protein.J Biomed Opt. 2016 Nov 1;21(11):115001. doi: 10.1117/1.JBO.21.11.115001. J Biomed Opt. 2016. PMID: 27805248 Free PMC article.
References
-
- Demay RM. The Pap Test. Chicago: ASCP (American Society for Clinical Pathology) Press; 2005.
-
- Ludlow EB, Ashfaq R, Hoda RS, Kaminsky DB, Lightfoot SA, Linder J, McKee GT, Pereira TC, Pisharodi L, Silverman JF, Smith RA, Wang HH, Weir MM. ThinPrep® Non-Gyn Morphology Reference Atlas. Marlborough, MA: Cytyc Corp.; 2005.
Publication types
MeSH terms
Grants and funding
LinkOut - more resources
Full Text Sources
Miscellaneous

