. 2012 Aug 30:12:154.
doi: 10.1186/1471-2229-12-154.

A putative role for amino acid permeases in sink-source communication of barley tissues uncovered by RNA-seq

Affiliations

A putative role for amino acid permeases in sink-source communication of barley tissues uncovered by RNA-seq

Stefan Kohl et al. BMC Plant Biol. .

Abstract

Background: The majority of nitrogen accumulating in cereal grains originates from proteins remobilised from vegetative organs. However, interactions between grain filling and remobilisation are poorly understood. We used transcriptome large-scale pyrosequencing of flag leaves, glumes and developing grains to identify cysteine peptidase and N transporter genes playing a role in remobilisation and accumulation of nitrogen in barley.

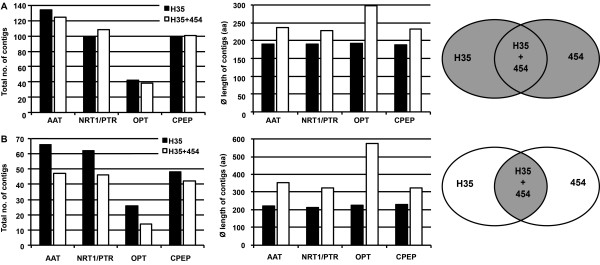
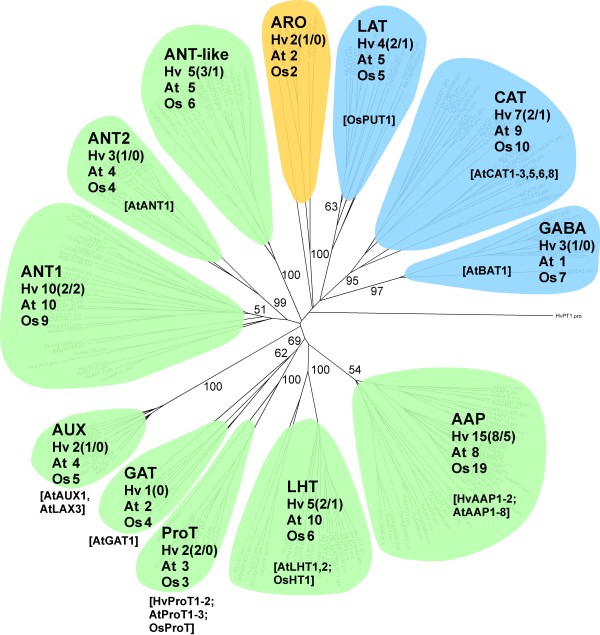
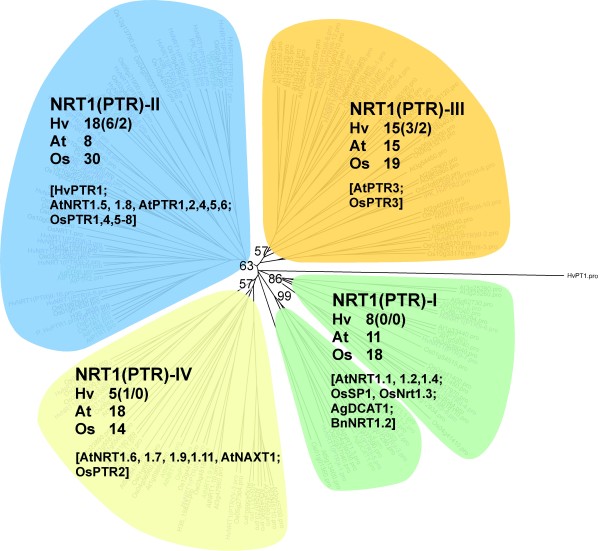
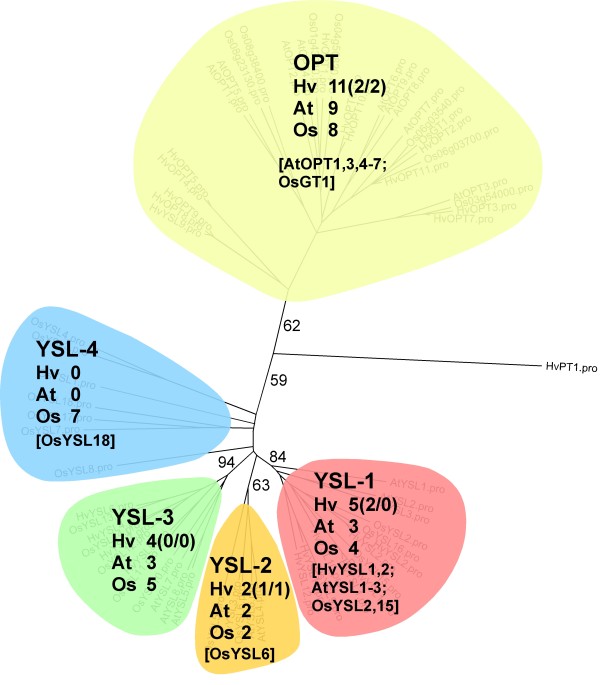
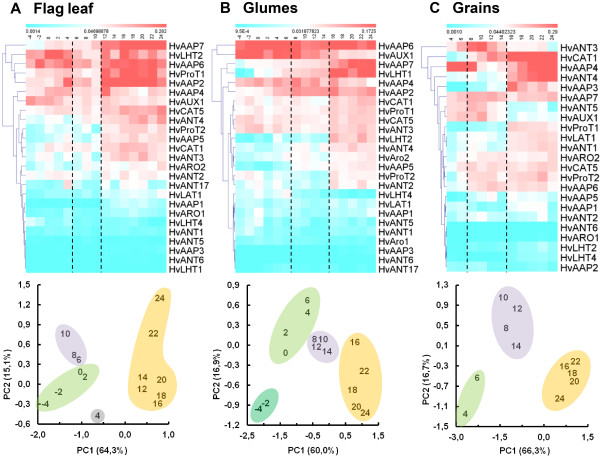
Results: Combination of already known and newly derived sequence information reduced redundancy, increased contig length and identified new members of cysteine peptidase and N transporter gene families. The dataset for N transporter genes was aligned with N transporter amino acid sequences of rice and Arabidopsis derived from Aramemnon database. 57 AAT, 45 NRT1/PTR and 22 OPT unigenes identified by this approach cluster to defined subgroups in the respective phylogenetic trees, among them 25 AAT, 8 NRT1/PTR and 5 OPT full-length sequences. Besides, 59 unigenes encoding cysteine peptidases were identified and subdivided into different families of the papain cysteine peptidase clade. Expression profiling of full-length AAT genes highlighted amino acid permeases as the group showing highest transcriptional activity. HvAAP2 and HvAAP6 are highly expressed in vegetative organs whereas HvAAP3 is grain-specific. Sequence similarities cluster HvAAP2 and the putative transporter HvAAP6 together with Arabidopsis transporters, which are involved in long-distance transfer of amino acids. HvAAP3 is closely related to AtAAP1 and AtAAP8 playing a role in supplying N to developing seeds. An important role in amino acid re-translocation can be considered for HvLHT1 and HvLHT2 which are specifically expressed in glumes and flag leaves, respectively. PCA and K-means clustering of AAT transcript data revealed coordinate developmental stages in flag leaves, glumes and grains. Phloem-specific metabolic compounds are proposed that might signal high grain demands for N to distantly located plant organs.

Conclusions: The approach identified cysteine peptidases and specific N transporters of the AAT family as obviously relevant for grain filling and thus, grain yield and quality in barley. Up to now, information is based only on transcript data. To make it relevant for application, the role of identified candidates in sink-source communication has to be analysed in more detail.


Figures

Figure 1
Figure 1
Venn diagram showing tissue specificity of the CAP3-contigs.
Figure 2
Figure 2
Blast2GO annotation of RNA-seq contigs and H35 unigenes. The result is based on gene ontology terms level 3 of the category Molecular Function. 21,525 sequences from flag leaves, 10,361 sequences from glumes, 21,199 sequences from grains and 22,043 sequences from the H35 database were annotated.
Figure 3
Figure 3
Venn diagrams showing organ-specific expression of N transporters and cysteine peptidases.
Figure 4
Figure 4
New sequence information for N transporter and cysteine peptidase genes. Comparison of RNA-seq and H35 unigenes for (A) AAT, (B) NRT1/PTR and (C) OPT transporter sequences and for (D) cysteine peptidase unigenes. New information (black areas) from RNA-seq shows less than 98% identity to H35 unigenes at amino acid level. Additional information (gray-shaded) matches H35 unigenes, but extends information by more than 50 bp or closes gaps between unigenes. Known information (white areas) did not add new knowledge. Origin of sequences is represented by gray-shaded areas of the overlapping ellipses at the right side.
Figure 5
Figure 5
Number and average length of unigenes encoding putative N transporters and cysteine peptidases. (A) Total number and average length of contigs after assembly of all N transporter and cysteine peptidase unigenes available from RNA-seq and H35. (B) Number and length of N transporter and cysteine peptidase contigs containing sequence information overlapping between the two sources. Black bars represent H35 information, white bars show results after combining H35 and RNA-seq unigenes. Gray-shaded areas in the ellipses at the right-hand side represent the origin of the sequences.
Figure 6
Figure 6
Phylogenetic tree of plant AATs. Clustering of 63 Arabidopsis, 80 rice and 59 unique barley sequences with H. vulgare phosphate transporter 1 (HvPT1) as outgroup. Colours indicate membership to different subgroups of ATF (green) and APC (blue) families, members of the aromatic amino acid transporters are shown in orange. Full-length barley sequences are given in brackets (total number/new from RNA-seq), functionally characterized transporters are given in square brackets and mentioned in Additional file 2: Table S2. Sequences from Arabidopsis and rice, including their respective nomenclature, were extracted from Aramemnon, barley sequences derived from RNA-seq, H35 (only full-length sequences), publications (HvProT, HvProT2) and previous unpublished work (HvAAP1 + 2) - see also Additional file 2: Table S2. The phylogenetic tree was constructed using the neighbor-joining algorithm in the program PAUP* [78]. The tree was displayed and manipulated using FigTree [79]. Clustering of AAT sequences into different subgroups is supported by the sequence distance matrices (Additional file 3: Figure S2). Detailed version of the phylogenetic tree including ID-numbers of all sequences is given in Additional file 1: Figure S1.
Figure 7
Figure 7
Phylogenetic tree of plant NRT1/PTRs. Clustering of 52 Arabidopsis, 81 rice and 46 unique barley sequences; for consolidation of the tree, sequences from Alnus glutinosa (AgDCAT1) and Brassica napus (BnNRT1) were included (according to Tsay et al. [14]). Colours indicate membership to subgroups I (green), II (blue), III (orange) and IV (yellow) as defined by Tsay et al. [14]. Barley sequences were derived from RNA-seq, H35 (only full-length sequences), publications (HvPTR1) and previous unpublished work (IPK_HvPTR2, 3, 6). Clustering of NRT1/PTR sequences into different subgroups is supported by the sequence distance matrices (Additional file 5: Figure S4). Detailed version of the phylogenetic tree including ID-numbers of all sequences is given in Additional file 4: Figure S3. For further explanations see legend of Figure 6.
Figure 8
Figure 8
Phylogenetic tree of plant OPTs. Clustering of 17 Arabidopsis, 26 rice and 22 unique barley sequences. Colours indicate membership to the OPT (yellow) and the yellow stripe-like (YSL) family. According to Zheng et al. [26] YSL transporter sequences are subdivided into the subgroups YSL-1 (red), YSL-2 (orange), YSL-3 (green) and YSL-4 (blue). Barley sequences were derived from RNA-seq and publications (HvYSL1 + 2). Clustering of OPT sequences into different subgroups is supported by the sequence distance matrices (Additional file 6: Figure S6). Detailed version of the phylogenetic tree including ID-numbers of all sequences is given in Additional file 7: Figure S5. For further explanations see legend of Figure 6.
Figure 9
Figure 9
Transcript profiling, principle component analysis (PCA) and K-means clustering of 25 AAT genes. Distinct developmental phases were identified in flag leaves (A), glumes (B) and developing grains (C). Tissues were analysed in two-day steps starting 4 days before anthesis (-4) in flag leaves and glumes and at 4 DAF in developing grains until 24 DAF. The heat maps (upper panels) reflect relative transcript abundances after normalisation against actin expression (blue = low expression; red = high expression). Developmental phases as identified by PCA are given in the lower panels, numbers represent DAF. Results of K-means clustering are visualized by encircling of respective stages. Light violet areas represent the transition phase.

References

    1. Peoples MBDM. The interlplay between proteolysis and amino acid metabolism during senescence and aging in plants. New York: AcademicPress Inc; 1988.
    1. Peeters KMU, Van Laere AJ. Amino acid metabolism associated with N-mobilization from the flag leaf of wheat (Triticum aestivum L.) during grain development. Plant Cell Environ. 1994;17(2):131–141. doi: 10.1111/j.1365-3040.1994.tb00276.x. - DOI
    1. Simpson RJ, Lambers H, Dalling MJ. Nitrogen Redistribution during Grain Growth in Wheat (Triticum aestivum L.): IV. Development of a Quantitative Model of the Translocation of Nitrogen to the Grain. Plant Physiol. 1983;71(1):7–14. doi: 10.1104/pp.71.1.7. - DOI - PMC - PubMed
    1. Hörtensteiner S, Feller U. Nitrogen metabolism and remobilization during senescence. J Exp Bot. 2002;53(370):927–937. doi: 10.1093/jexbot/53.370.927. - DOI - PubMed
    1. Masclaux-Daubresse C, Reisdorf-Cren M, Orsel M. Leaf nitrogen remobilisation for plant development and grain filling. Plant Biology. 2008;10:23–36. - PubMed

Publication types

MeSH terms