

30-Day risk-standardized mortality and readmission rates after ischemic stroke in critical access hospitals
- PMID: 22935397
- PMCID: PMC3547601
- DOI: 10.1161/STROKEAHA.112.665646
30-Day risk-standardized mortality and readmission rates after ischemic stroke in critical access hospitals
Erratum in
- Stroke. 2012 Nov;43(11):e170
Abstract
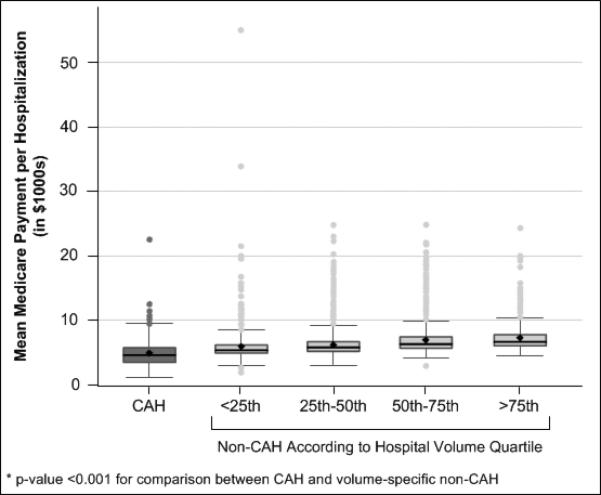
Background and purpose: The critical access hospital (CAH) designation was established to provide rural residents with local access to emergency and inpatient care. CAHs, however, have poorer short-term outcomes for pneumonia, heart failure, and myocardial infarction compared with other hospitals. We assessed whether 30-day risk-standardized mortality rates (RSMRs) and risk-standardized readmission rates (RSRRs) after ischemic stroke differ between CAHs and non-CAHs.
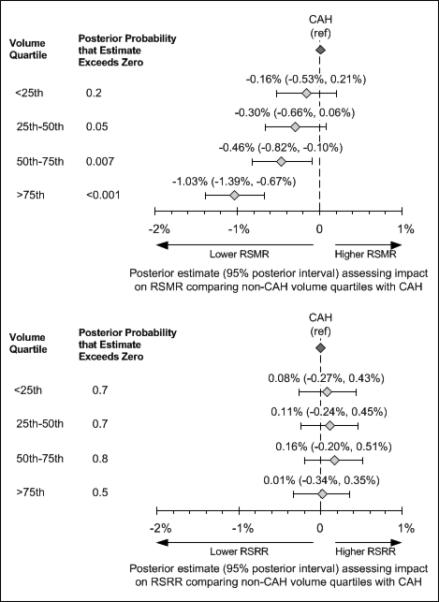
Methods: The study included all fee-for-service Medicare beneficiaries 65 years of age or older with a primary discharge diagnosis of ischemic stroke (International Classification of Diseases, 9th revision codes 433, 434, 436) in 2006. Hierarchical generalized linear models calculated hospital-level RSMRs and RSRRs, adjusting for patient demographics, medical history, and comorbid conditions. Non-CAHs were categorized by hospital volume quartiles and the RSMR and RSRR posterior probabilities in comparison with CAHs were determined using linear regression with Markov chain Monte Carlo simulation.
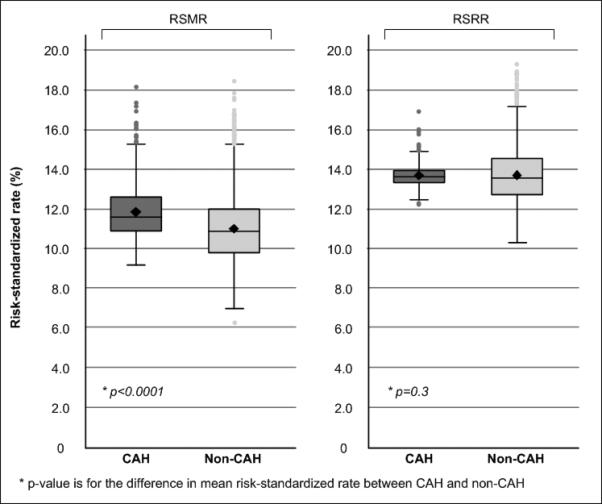
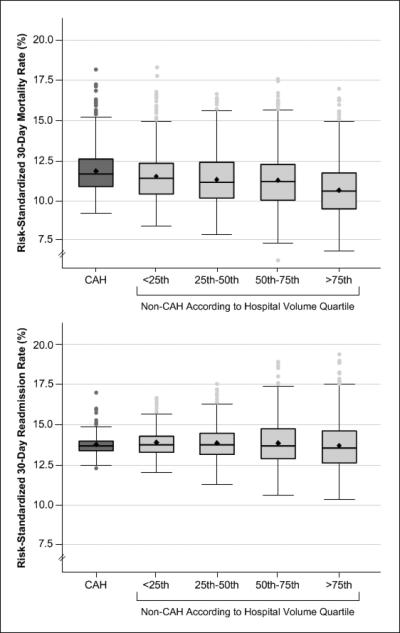
Results: There were 10 267 ischemic stroke discharges from 1165 CAHs and 300 114 discharges from 3381 non-CAHs. The RSMRs of CAHs were higher than non-CAHs (11.9%± 1.4% vs 10.9%± 1.7%; P<0.001), but the RSRRs were comparable (13.7%± 0.6% vs 13.7%± 1.4%; P=0.3). The RSMRs for the 2 higher volume quartiles of non-CAHs were lower than CAHs (posterior probability of RSMRs higher than CAHs=0.007 for quartile 3; P<0.001 for quartile 4), but there were no differences for lower volume hospitals; RSRRs did not vary by annual hospital volume.
Conclusions: CAHs had higher RSMRs compared with non-CAHs, but readmission rates were similar. The observed differences may be partly explained by patient characteristics and annual hospital volume.
Figures
References
-
- Casey M, Burlew M, Moscovice I. Critical Access Hospital Year 6 Hospital Compare Participation and Quality Measure Results:. Flex Monitoring Team briefing paper No. 28. Rural Health Research Center; Minneapolis, MN: 2011. [October 1, 2011]. Available at: www.flexmonitoring.org.
-
- Cameron A, Zelman B, Stewart S. Financial Condition of Critical Access Hospitals: 1996-1999. In: Rural Hospital Flexibility Program Tracking Team, editor. Rural Hospital Flexibility Program Tracking Project Year One Report. WWAMI Rural Health Research Center, University of Washington; Seattle, WA: 2001. [December 1, 2011]. Available at: http://www.rupri.org/.
-
- Stensland J, Davidson G, Moscovice I. The Financial Benefits of Critical Access Hospital Conversion for FY 1999 and FY 2000 Converters. [December 1, 2011];2001 Available at: http://www.sph.umn.edu/hpm/rhrc/pdfs/wpaper/wpaper051.pdf.
Publication types
MeSH terms
Grants and funding
LinkOut - more resources
Full Text Sources
Medical
