

Polycyclic aromatic hydrocarbons as skin carcinogens: comparison of benzo[a]pyrene, dibenzo[def,p]chrysene and three environmental mixtures in the FVB/N mouse
- PMID: 22935520
- PMCID: PMC3483092
- DOI: 10.1016/j.taap.2012.08.014
Polycyclic aromatic hydrocarbons as skin carcinogens: comparison of benzo[a]pyrene, dibenzo[def,p]chrysene and three environmental mixtures in the FVB/N mouse
Abstract
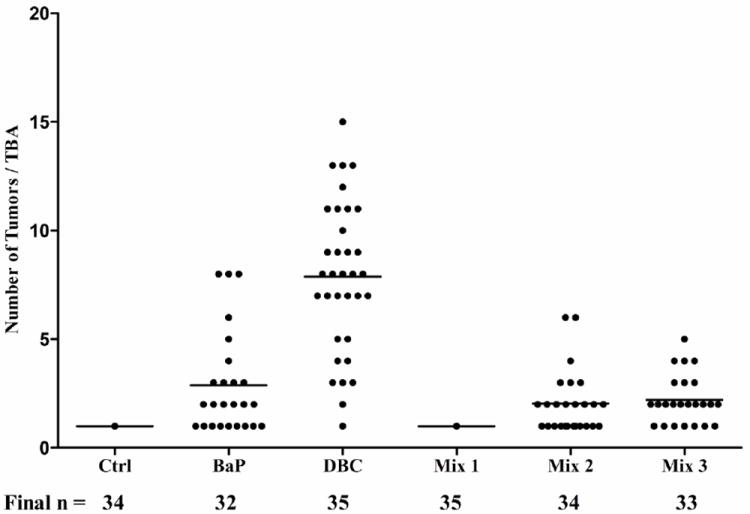
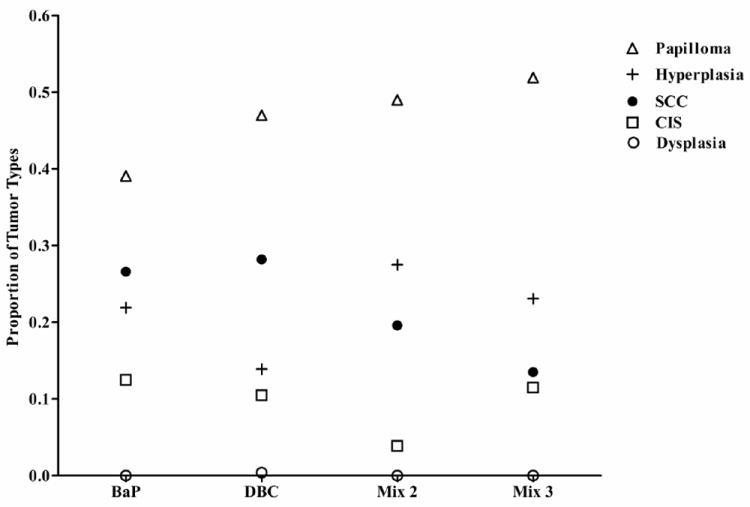
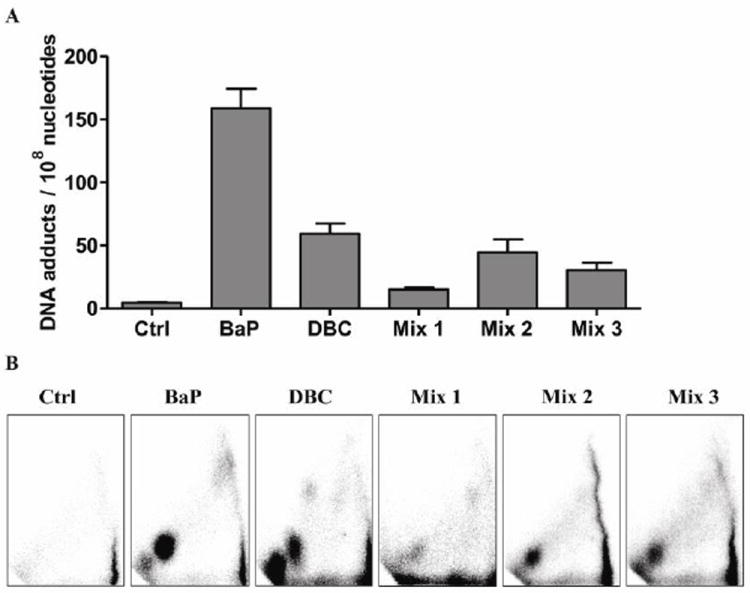
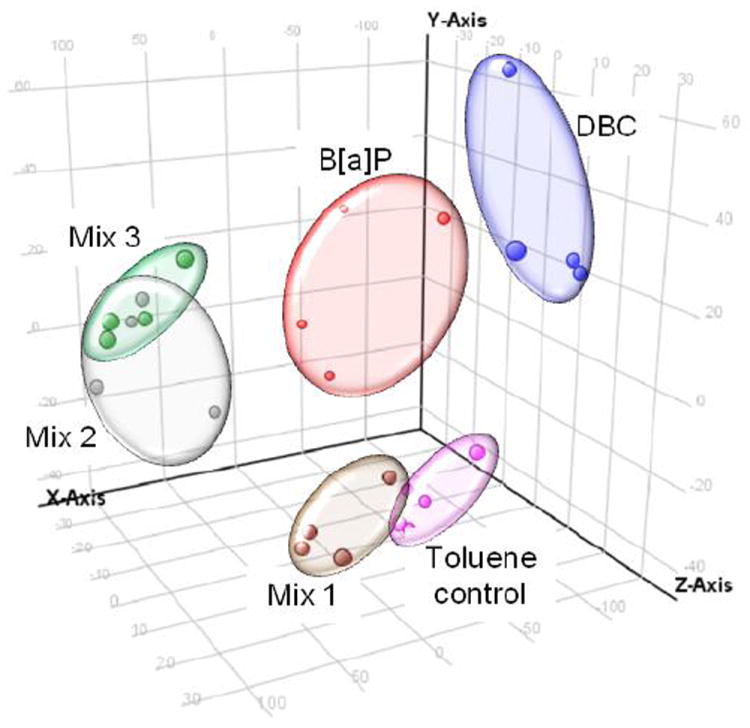
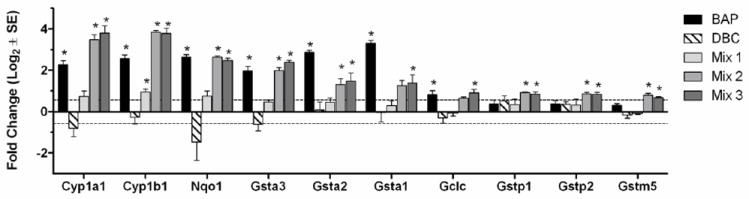
The polycyclic aromatic hydrocarbon (PAH), benzo[a]pyrene (BaP), was compared to dibenzo[def,p]chrysene (DBC) and combinations of three environmental PAH mixtures (coal tar, diesel particulate and cigarette smoke condensate) using a two stage, FVB/N mouse skin tumor model. DBC (4nmol) was most potent, reaching 100% tumor incidence with a shorter latency to tumor formation, less than 20 weeks of 12-O-tetradecanoylphorbol-13-acetate (TPA) promotion compared to all other treatments. Multiplicity was 4 times greater than BaP (400 nmol). Both PAHs produced primarily papillomas followed by squamous cell carcinoma and carcinoma in situ. Diesel particulate extract (1 mg SRM 1650b; mix 1) did not differ from toluene controls and failed to elicit a carcinogenic response. Addition of coal tar extract (1 mg SRM 1597a; mix 2) produced a response similar to BaP. Further addition of 2 mg of cigarette smoke condensate (mix 3) did not alter the response with mix 2. PAH-DNA adducts measured in epidermis 12 h post initiation and analyzed by ³²P post-labeling, did not correlate with tumor incidence. PAH-dependent alteration in transcriptome of skin 12 h post initiation was assessed by microarray. Principal component analysis (sum of all treatments) of the 922 significantly altered genes (p<0.05), showed DBC and BaP to cluster distinct from PAH mixtures and each other. BaP and mixtures up-regulated phase 1 and phase 2 metabolizing enzymes while DBC did not. The carcinogenicity with DBC and two of the mixtures was much greater than would be predicted based on published Relative Potency Factors (RPFs).
Copyright © 2012 Elsevier Inc. All rights reserved.
Conflict of interest statement
Conflict of Interest Statement
None of the authors of this manuscript have any conflicts of interest associated with this work.
Figures

Similar articles
-
Cytochrome P450 1b1 in polycyclic aromatic hydrocarbon (PAH)-induced skin carcinogenesis: Tumorigenicity of individual PAHs and coal-tar extract, DNA adduction and expression of select genes in the Cyp1b1 knockout mouse.Toxicol Appl Pharmacol. 2015 Sep 1;287(2):149-160. doi: 10.1016/j.taap.2015.05.019. Epub 2015 Jun 3. Toxicol Appl Pharmacol. 2015. PMID: 26049101 Free PMC article.
-
The influence of diesel exhaust on polycyclic aromatic hydrocarbon-induced DNA damage, gene expression, and tumor initiation in Sencar mice in vivo.Cancer Lett. 2008 Jun 28;265(1):135-47. doi: 10.1016/j.canlet.2008.02.017. Epub 2008 Mar 18. Cancer Lett. 2008. PMID: 18353537 Free PMC article.
-
Comparative mechanisms of PAH toxicity by benzo[a]pyrene and dibenzo[def,p]chrysene in primary human bronchial epithelial cells cultured at air-liquid interface.Toxicol Appl Pharmacol. 2019 Sep 15;379:114644. doi: 10.1016/j.taap.2019.114644. Epub 2019 Jun 27. Toxicol Appl Pharmacol. 2019. PMID: 31255691 Free PMC article.
-
Carcinogenicity of airborne fine particulate benzo(a)pyrene: an appraisal of the evidence and the need for control.Environ Health Perspect. 1981 Dec;42:163-85. doi: 10.1289/ehp.8142163. Environ Health Perspect. 1981. PMID: 6277615 Free PMC article. Review.
-
Application of the margin-of-exposure (MoE) approach to substances in food that are genotoxic and carcinogenic e.g.: benzo[a]pyrene and polycyclic aromatic hydrocarbons.Food Chem Toxicol. 2010 Jan;48 Suppl 1:S42-8. doi: 10.1016/j.fct.2009.09.039. Epub 2009 Oct 8. Food Chem Toxicol. 2010. PMID: 19818825 Review.
Cited by
-
Application of a fuzzy neural network model in predicting polycyclic aromatic hydrocarbon-mediated perturbations of the Cyp1b1 transcriptional regulatory network in mouse skin.Toxicol Appl Pharmacol. 2013 Mar 1;267(2):192-9. doi: 10.1016/j.taap.2012.12.011. Epub 2012 Dec 27. Toxicol Appl Pharmacol. 2013. PMID: 23274566 Free PMC article.
-
Solar simulated light exposure alters metabolization and genotoxicity induced by benzo[a]pyrene in human skin.Sci Rep. 2018 Oct 2;8(1):14692. doi: 10.1038/s41598-018-33031-8. Sci Rep. 2018. PMID: 30279536 Free PMC article.
-
The environmental carcinogen benzo[a]pyrene regulates epigenetic reprogramming and metabolic rewiring in a two-stage mouse skin carcinogenesis model.Carcinogenesis. 2023 Aug 10;44(5):436-449. doi: 10.1093/carcin/bgad024. Carcinogenesis. 2023. PMID: 37100755 Free PMC article.
-
Advances in cutaneous squamous cell carcinoma.Nat Rev Cancer. 2023 Jul;23(7):430-449. doi: 10.1038/s41568-023-00583-5. Epub 2023 Jun 7. Nat Rev Cancer. 2023. PMID: 37286893 Review.
-
Arsenite Interacts with Dibenzo[def,p]chrysene (DBC) at Low Levels to Suppress Bone Marrow Lymphoid Progenitors in Mice.Biol Trace Elem Res. 2015 Jul;166(1):82-8. doi: 10.1007/s12011-015-0279-6. Epub 2015 Mar 6. Biol Trace Elem Res. 2015. PMID: 25739538 Free PMC article.
References
-
- Andrysik Z, Vondracek J, Marvanova S, Ciganek M, Neca J, Pencikova K, Mahadevan B, Topinka J, Baird WM, Kozubik A, Machala M. Activation of the aryl hydrocarbon receptor is the major toxic mode of action of an organic extract of a reference urban dust particulate matter mixture: the role of polycyclic aromatic hydrocarbons. Mutat Res. 2011;714:53–62. - PubMed
-
- Arif JM, Smith WA, Gupta RC. DNA adduct formation and persistence in rat tissues following exposure to the mammary carcinogen dibenzo[a,l]pyrene. Carcinogenesis. 1999;20:1147–1150. - PubMed
-
- Arlt VM, Stiborova M, Henderson CJ, Thiemann M, Frei E, Aimova D, Singh R, Gamboa da Costa G, Schmitz OJ, Farmer PB, Wolf CR, Phillips DH. Metabolic activation of benzo[a]pyrene in vitro by hepatic cytochrome P450 contrasts with detoxification in vivo: experiments with hepatic cytochrome P450 reductase null mice. Carcinogenesis. 2008;29:656–665. - PubMed
-
- ATSDR. Priority list of hazardous substances. 2011 http://www.atsdr.cdc.gov/SPL/resources/
Publication types
MeSH terms
Substances
Grants and funding
LinkOut - more resources
Full Text Sources
Medical
Molecular Biology Databases
