. 2013 Feb;20(2):198-208.
doi: 10.1038/cdd.2012.112. Epub 2012 Aug 31.

The prolyl-isomerase Pin1 activates the mitochondrial death program of p53

Affiliations

The prolyl-isomerase Pin1 activates the mitochondrial death program of p53

G Sorrentino et al. Cell Death Differ. 2013 Feb.

Abstract

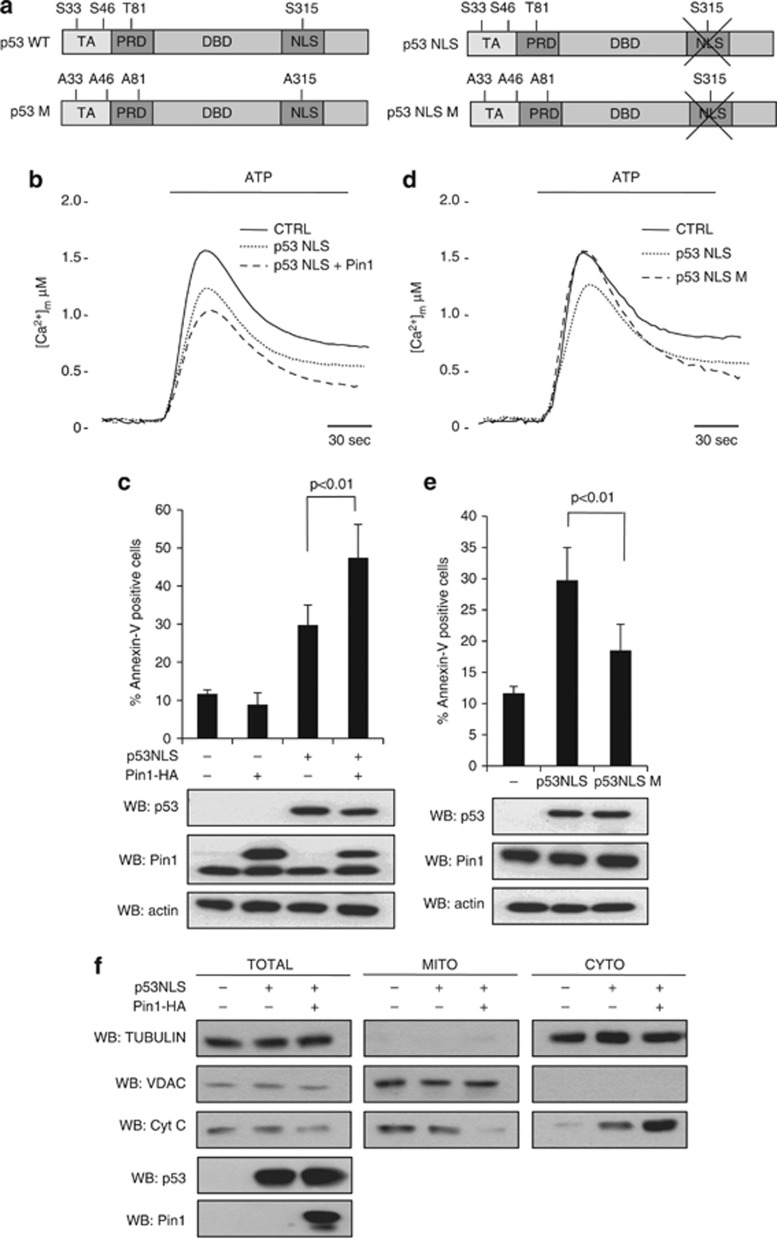
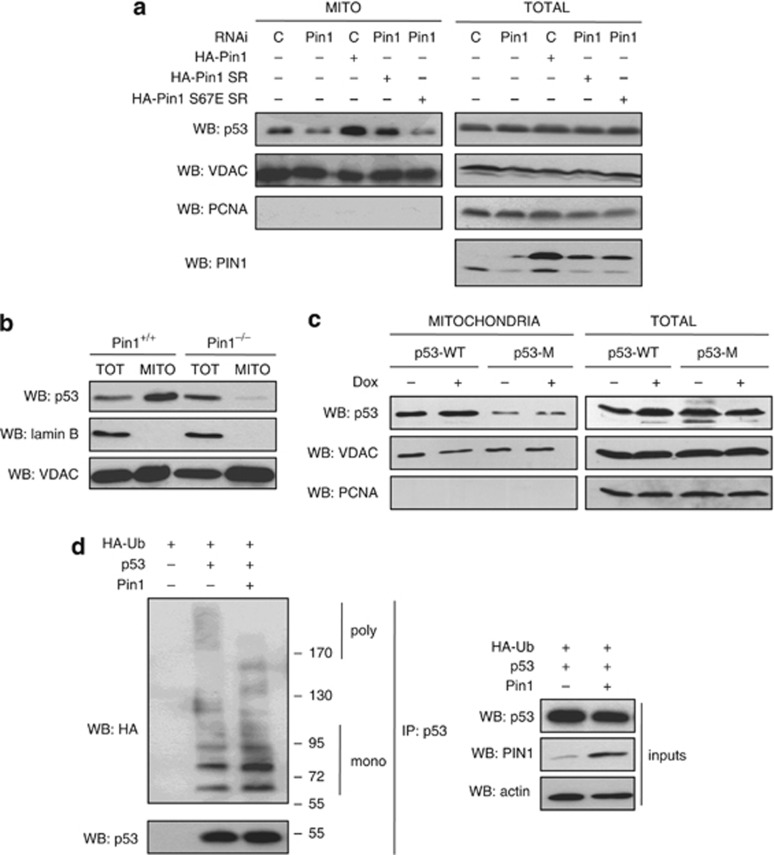
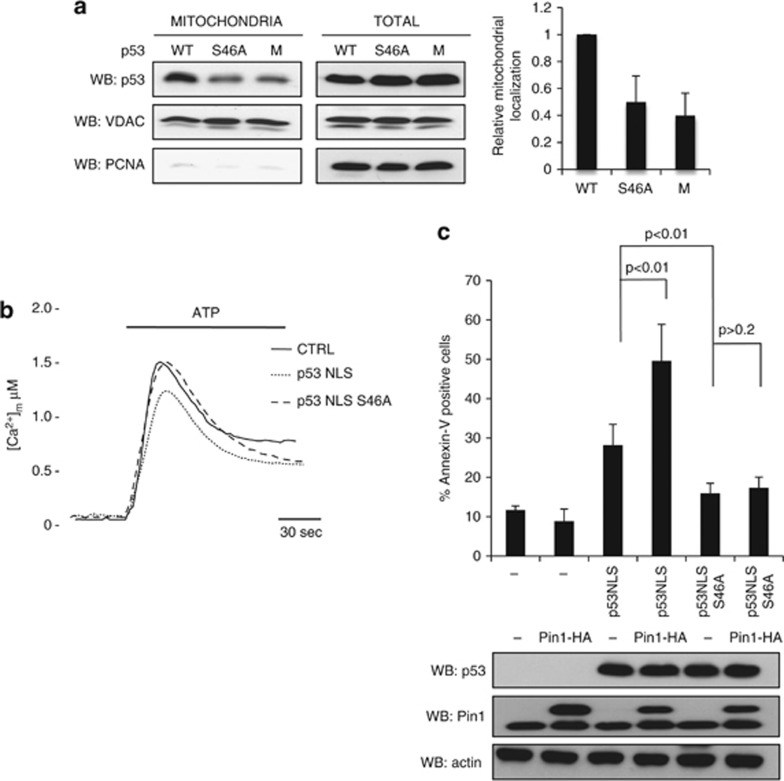
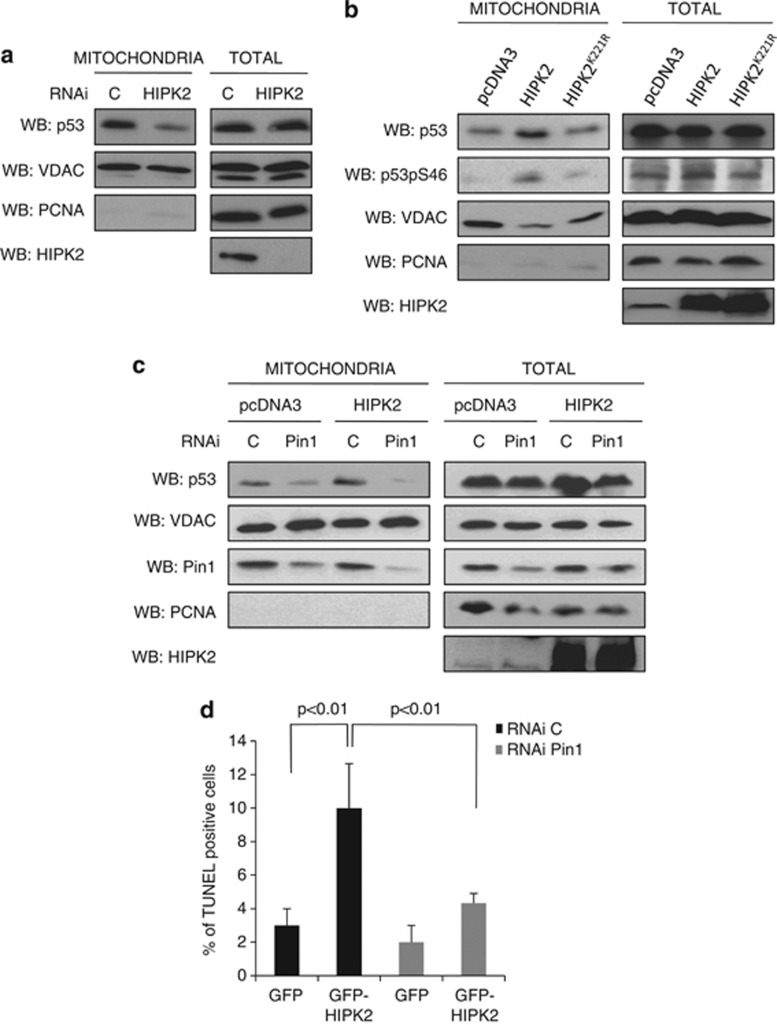
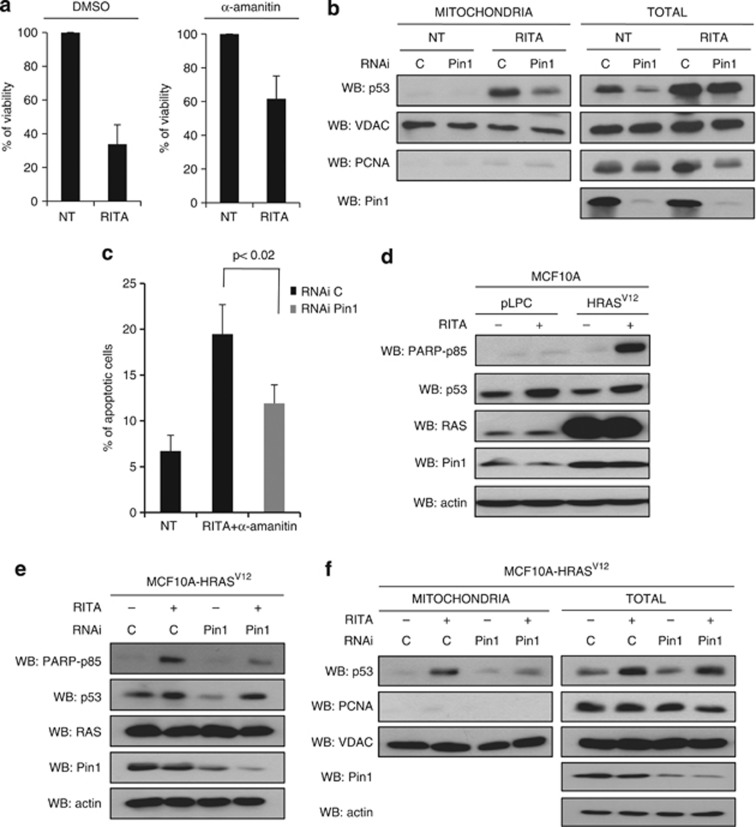
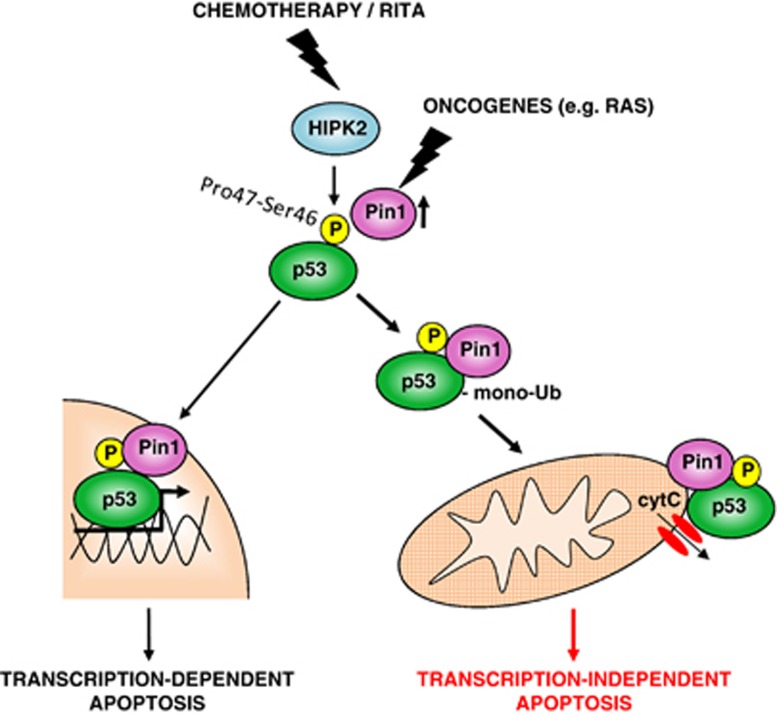
In response to intense stress, the tumor protein p53 (p53) tumor suppressor rapidly mounts a direct mitochondrial death program that precedes transcription-mediated apoptosis. By eliminating severely damaged cells, this pathway contributes to tumor suppression as well as to cancer cell killing induced by both genotoxic drugs and non-genotoxic p53-reactivating molecules. Here we have explored the role had in this pathway by the prolyl-isomerase Pin1 (peptidylprolyl cis/trans isomerase, NIMA-interacting 1), a crucial transducer of p53's phosphorylation into conformational changes unleashing its pro-apoptotic activity. We show that Pin1 promotes stress-induced localization of p53 to mitochondria both in vitro and in vivo. In particular, we demonstrate that upon stress-induced phosphorylation of p53 on Ser46 by homeodomain interacting protein kinase 2, Pin1 stimulates its mitochondrial trafficking signal, that is, monoubiquitination. This pathway is induced also by the p53-activating molecule RITA, and we demonstrate the strong requirement of Pin1 for the induction of mitochondrial apoptosis by this compound. These findings have significant implications for treatment of p53-expressing tumors and for prospective use of p53-activating compounds in clinics.


Figures

Figure 1
Figure 1
Pin1 potentiates p53-mediated transcription-independent apoptosis. (a) Scheme of p53 expression constructs indicating Pin1-binding sites (phospho-Ser/Thr-Pro). TA, transactivation domain; DBD, DNA binding domain; NLS, nuclear localization signal. The nuclear import-deficient p53 mutant p53NLS has mutations in all three C-terminal NLS motifs. p53-M bears Ser/Thr to Ala substitutions at Pin1 binding sites Ser33, Ser46, Thr81 and Ser315. p53NLS-M bears Ser/Thr to Ala substitutions at Ser33, Ser46 and Thr81. (b) Mitochondrial Ca2+ analysis in H1299 cells overexpressing p53NLS alone or co-transfected with Pin1. H1299 cells were co-transfected with an aequorin chimera targeted to the mitochondrial matrix and with either the plasmid of interest or an empty vector (control). Thirty-six hours after transfection, measurement of aequorin luminescence was carried out and calibrated into [Ca2+] values, as described in the Materials and Methods section. Where indicated, the cells, perfused with KRB, were challenged with 100 μM ATP, added to the same buffer. Peak values 1.58±0.03 μM for control (solid line) n=14; 1.18±0.09 μM for p53 NLS (dotted line) n=13, P<0.01; p53NLS plus Pin1 (dashed line) 0.93±0.04 μM, n=9, P<0.01. These and the following traces are representative of at least 10 experiments, that gave similar results. (c) p53NLS was overexpressed in p53-null H1299 cells either alone or along with Pin1-HA. The percentage of cells undergoing apoptosis upon treatment with etoposide 50 μM for 24 h was estimated by AnnexinV/propidium-iodide staining and FACS analysis. The graph shows mean results and S.D. of three independent experiments. (d) Mitochondrial Ca2+ response was performed as above, comparing H1299 cells overexpressing p53NLS with p53NLS M proteins. Peak values: control and p53NLS are as in b. p53 NLS-M 1.57±0.05 μM, n=12. (e) The ability of p53NLS and p53NLS-M proteins to induce transcription-independent apoptosis was compared by AnnexinV/propidium-iodide staining and FACS analysis upon overexpression in p53-null H1299 cells and treatment with etoposide 50 μM for 24 h. The graph shows mean results and S.D. of three independent experiments. (f) The effect of Pin1 overexpression on release of cytochrome c from mitochondria to the cytoplasm was detected by WB after subcellular fractionation of H1299 cells transfected with the indicated constructs and treated with etoposide 50 μM for 24 h
Figure 2
Figure 2
Pin1 stimulates mitochondrial localization of p53. (a) The effect of Pin1 depletion and overexpression on mitochondrial accumulation of endogenous p53 protein was analyzed by WB on both mitochondrial fractions and total lysates of HCT116 p53+/+ cells. Cells were transduced with retroviral vector pMSCV expressing either Pin1-HA, siRNA-resistant (SR) Pin1-HA, siRNA-resistant Pin1-HA-S67E (catalytically inactive) or empty vector, and then transfected with Pin1-specific RNAi or control RNAi. Forty-eight hours after transfection, cells were treated with doxorubicin (Dox) 1 μM for 6 h and processed for subcellular fractionation. (b) Rapid mitochondrial localization of p53 in cardiac muscle in vivo was compared in wt (Pin1+/+) and Pin1-KO (Pin1−/−) mice treated IP with 20 mg/kg of doxorubicin for 3 h. Western blots show p53 content in total lysate (TOT) of heart tissue and in mitochondrial fraction (MITO). Mitochondrial purity from nuclear contamination was verified by Lamin B WB. (c) The ability of p53-WT and p53-M proteins (Figure 1a) to localize at mitochondria was compared as in Figure 2a upon transfection in HCT116 p53−/− cells and treatment with doxorubicin (Dox) 1 μM for 6 h. (d) The effect of Pin1 on the balance between mono- and polyubiquitinated forms of p53 was analyzed in H1299 cells transfected with constructs expressing p53, HA-ubiquitin and Pin1 in the indicated combinations, and then treated with doxorubicin 1 μM for 6 h and with the proteasome inhibitor MG-132 50 μM for 4 h before IP and WB analysis
Figure 3
Figure 3
Pin1 induces the mitochondrial function of p53 in a Ser46-dependent fashion. (a) The ability of p53-WT, p53-S46A and p53-M proteins to localize at mitochondria was compared by WB on the mitochondrial fraction upon transfection in HCT116 p53−/− cells and treatment with etoposide 50 μM for 6 h. Left panels: a representative experiment is shown. Right panel: quantification of relative mitochondrial localization of different p53 proteins was calculated as described in Methods section. The graph shows the mean results and S.D. of three independent experiments. (b) Mitochondrial Ca2+ response was performed as above, comparing H1299 cells overexpressing p53NLS with p53NLS S46A proteins. Peak values 1.57±0.03 μM for control, 1.51±0.06 μM for p53NLS S46A, n=10 each, versus 1.20±0.04 μM for p53NLS, P<0.01. (c) The ability of p53NLS and p53NLS-S46A proteins to induce transcription-independent apoptosis upon treatment with etoposide 50 μM for 24 h, and the relative effect of overexpression of Pin1-HA was compared by AnnexinV/PI staining and FACS analysis upon transfection of the indicated combinations of plasmids in H1299 cells. The graph shows the mean results and S.D. of three independent experiments
Figure 4
Figure 4
HIPK2 and Pin1 cooperate to induce p53-dependent direct apoptosis. (a) HIPK2 promotes mitochondrial localization of p53. Accumulation of endogenous p53 within the mitochondrial fraction of HCT116 p53+/+ cells was analyzed by WB upon RNAi-mediated knockdown of HIPK2 and treatment with doxorubicin 1 μM for 6 h. C: control RNAi. (b) Mitochondrial localization of endogenous p53 upon overexpression of either wild-type HIPK2 or the catalytically inactive mutant HIPK2K221R in HCT116 p53+/+ cells and treatment with 1 μM doxorubicin for 6 h was analyzed as in a. (c) Pin1 is required for the ability of HIPK2 to promote mitochondrial localization of p53. The effect of wild-type HIPK2 overexpression on the mitochondrial localization of endogenous p53 was evaluated as in a in HCT116 p53+/+ cells treated with doxorubicin 1 μM for 6 h upon RNAi-mediated knockdown of Pin1 expression. (d) To estimate the roles of HIPK2 and Pin1 in inducing transcription-independent apoptosis, HCT116 p53+/+ cells transfected with the indicated combinations of GFP-HIPK2 expression vector and Pin1-specific RNAi were treated with α-amanitin 10 μg/ml. Apoptosis of GFP-expressing cells was then evaluated by TUNEL assays. The graph shows the mean results and S.D. of three independent experiments
Figure 5
Figure 5
Pin1 expression is required for RITA-induced transcription-independent apoptosis. (a) HCT116 p53+/+ cells were treated with RITA 1 μM alone or in combination with α-amanitin 10 μg/ml or left untreated. Cell viability was analyzed after 24 h. The graph shows the mean results and S.D. of three independent experiments. (b) The effect of Pin1 depletion by RNAi on mitochondrial localization of endogenous p53 protein upon treatment of HCT116 p53+/+ cells with RITA 1 μM for 24 h was analyzed by WB of mitochondrial fractions and total cell lysates. C: control RNAi. (c) HCT116 p53+/+ cells were transfected with Pin1-specific or control (C) siRNA before treatment with RITA 1 μM and α-amanitin 10 μg/ml for 24 h. The percentage of cells with sub-G1 DNA content (apoptotic cells) was estimated by PI staining and FACS analysis. The graph shows the mean results and S.D. of three independent experiments. (d) MCF10A cells stably transfected with either HRASV12 or empty vector (pLPC) were treated with RITA 1 μM for 24 h. Induction of apoptosis was then monitored by analyzing PARP cleavage by WB. The expression levels of HIPK2, p53, RAS and Pin1 were also compared by WB, using actin levels as loading control. (e) The effect of Pin1 depletion by RNAi on apoptosis of MCF10A-HRASV12 transformed cells upon treatment with RITA 1 μM for 24 h was analyzed by monitoring PARP cleavage by WB. (f) The effect of Pin1 depletion by RNAi on mitochondrial localization of endogenous p53 protein upon treatment of MCF10A-HRASV12 transformed cells with RITA 1 μM for 24 h was analyzed by WB of both mitochondrial fractions and total cell lysates
Figure 6
Figure 6
Model for regulation of both transcription-dependent and -independent apoptotic activity of p53 by Pin1. Treatment with either chemotherapeutic drugs or RITA leads to stabilization of the apoptotic kinase HIPK2 and consequent phosphorylation of p53 on Ser46. Subsequent prolyl-isomerization by Pin1 then leads to decreased polyubiquitination of p53 in favor of its monoubiquitination, with consequent relocalization of cytosolic p53 to mitochondria and induction of MOMP and direct apoptosis. On the other hand, Pin1-mediated isomerization of the Ser46-Pro47 site unlocks p53 from the apoptosis inhibitor iASPP, leading to induction of apoptotic target genes and establishment of a full apoptotic response

Similar articles

Cited by

References

    1. Vaseva AV, Moll UM. The mitochondrial p53 pathway. Biochim Biophys Acta. 2009;1787:414–420. - PMC - PubMed
    1. Green DR, Kroemer G. Cytoplasmic functions of the tumour suppressor p53. Nature. 2009;458:1127–1130. - PMC - PubMed
    1. Marchenko ND, Wolff S, Erster S, Becker K, Moll UM. Monoubiquitylation promotes mitochondrial p53 translocation. EMBO J. 2007;26:923–934. - PMC - PubMed
    1. Erster S, Mihara M, Kim RH, Petrenko O, Moll UM. In vivo mitochondrial p53 translocation triggers a rapid first wave of cell death in response to DNA damage that can precede p53 target gene activation. Mol Cell Biol. 2004;24:6728–6741. - PMC - PubMed
    1. Talos F, Petrenko O, Mena P, Moll UM. Mitochondrially targeted p53 has tumor suppressor activities in vivo. Cancer Res. 2005;65:9971–9981. - PubMed

Publication types

MeSH terms