. 2012 Oct 1;11(19):3679-90.
doi: 10.4161/cc.21944. Epub 2012 Aug 30.

Glutamine depletion and glucose depletion trigger growth inhibition via distinctive gene expression reprogramming

Affiliations

Glutamine depletion and glucose depletion trigger growth inhibition via distinctive gene expression reprogramming

Shuo Qie et al. Cell Cycle. .

Abstract

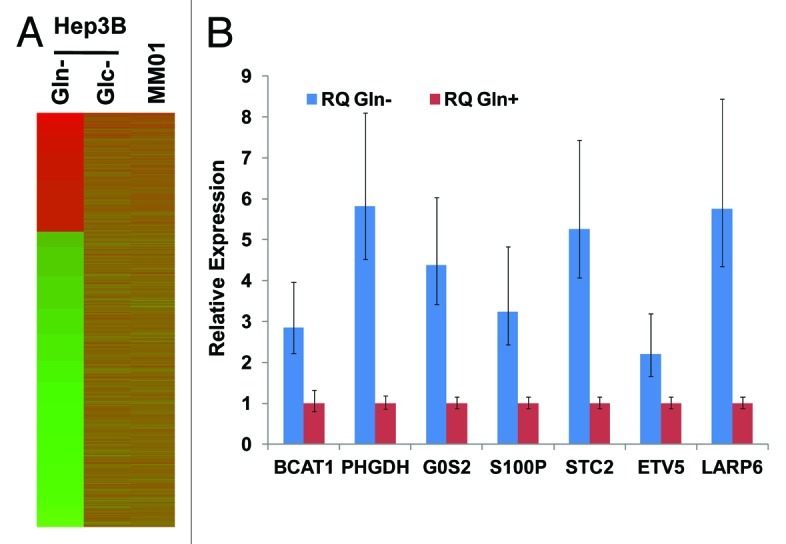
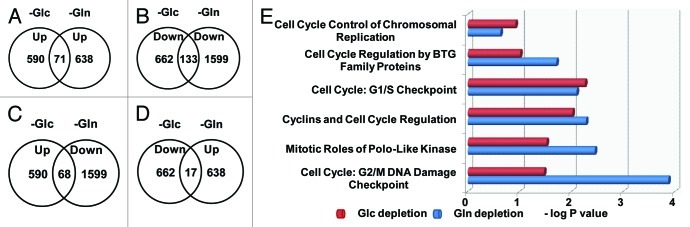
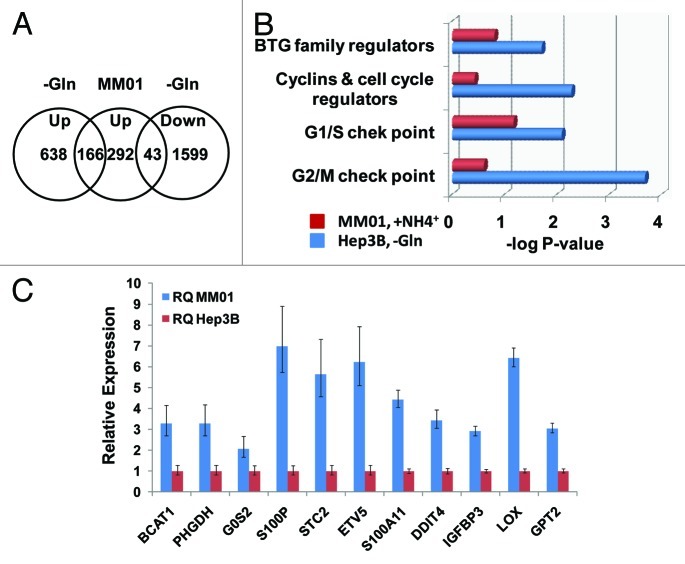
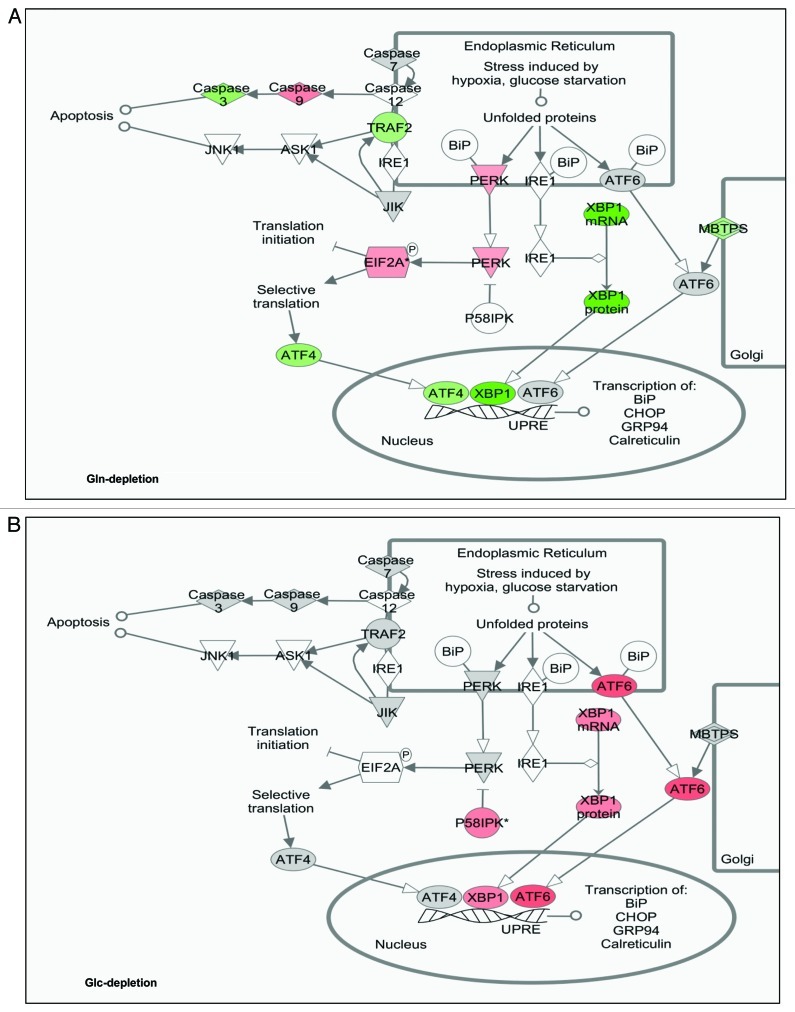
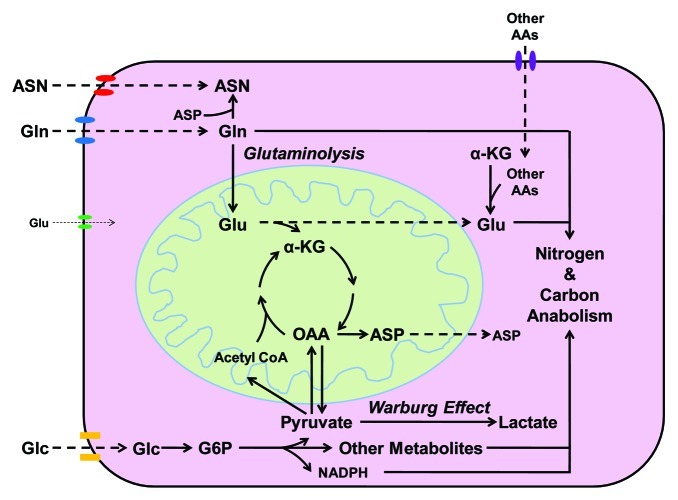
Glutamine (Gln) and glucose (Glc) represent two important nutrients for proliferating cells, consistent with the observations that oncogenic processes are associated with enhanced glycolysis and glutaminolysis. Gln depletion and Glc depletion have been shown to trigger growth arrest and eventually cell death. Solid tumors often outgrow the blood supply, resulting in ischemia, which is associated with hypoxia and nutrient insufficiency. Whereas oxygen-sensing and adaptive mechanisms to hypoxia have been well-studied, how cells directly sense and respond to Gln and Glc insufficiency remains unclear. Using mRNA profiling techniques, we compared the gene expression profiles of acute Gln-depleted cells, Glc-depleted cells and cells adapted to Gln depletion. Here we report the global changes of the gene expression in those cells cultured under the defined nutrient conditions. Analysis of mRNA profiling data revealed that Gln and Glc depletion triggered dramatic gene expression reprogramming. Either Gln or Glc deletion leads to changes of the expression of cell cycle genes, but these conditions have distinctive effects on transcription regulators and gene expression profiles. Moreover, Gln and Glc depletion triggered distinguishable ER-stress responses. The gene expression patterns support that Gln and Glc have distinctive metabolic roles in supporting cell survival and proliferation, and cells use different mechanisms to sense and respond to Gln and Glc insufficiency. Our mRNA profiling database provides a resource for further investigating the nutrient-sensing mechanisms and potential effects of Glc and Gln abundance on the biological behaviors of cells.


Figures

None
Figure 1. Gene expression in Hep3B cells with different treatments. (A) Heatmap of gene expression pattern in Gln- or Glc-depleted Hep3B and MM01 cells. (B) Validation of the upregulation of representative genes identified by mRNA profiling. TaqMan primers were purchased from Invitrogen. Levels of mRNA were determined by qRT-PCR. RNA samples isolated from Hep3B cells cultured in complete media were used as control, and mRNA levels in the control were arbitrarily defined as 1. Relative levels of mRNA in Gln-depleted cells were shown. For each sample and tested gene, qRT-PCR was performed at triplicate, and standard deviations were indicated. All data presented were statistically significant (p < 0.001).
None
Figure 2. Gln depletion and Glc depletion alter gene expression. (A–D) RNA samples from Hep3B cultured in complete media were used as control. For Glc depletion, log2 Ratio > 1 (upregulation) or < -1.0 (downregulation) was used as cut-off. Since Gln depletion caused dramatic change of gene expression levels, log2 Ratio > 2.0 (upregulation) or < -2.0 (downregulation) was set as cut-off. We noted that only a small portion of genes were upregulated under both conditions, or downregulated under both conditions. (E) Expression of cell cycle regulators in Gln- and Glc-depleted cells. Gene expression was analyzed by IPA. P value of the reprogramming of each group of cell cycle regulators were calculated according to established criteria and algorithm, and presented in -log as x-axis. Our data show that under both nutrient conditions, the expression of cyclins and cell cycle regulators was significantly changed. In particular, Gln depletion significantly altered the expression profiling of genes regulating G2/M and G1/S checkpoints, and Glc depletion mainly caused the reprogramming of genes regulating G1/S checkpoint.
None
Figure 3. Gene expression and cell cycle regulation in MM01 cells. In contrast to acute Gln-depleted cells, MM01 cells have adapted to Gln-free media. (A) Upregulated genes in MM01 and their expression states in acute Gln-depleted cells. In MM01 cells, 292 genes were identified as upregulated (log2 Ratio > 1.0). Among them, 166 were found upregulated, while 43 downregulated in acute Gln-depleted cells. (B) Functional analysis of cell cycle regulators in acute Gln-depleted Hep3B and MM01 cells. In acute Gln-depleted cells, all four groups of cell cycle regulatory genes were significantly reprogrammed (-log p values were given). On the other hand, the same groups of genes were not significantly affected. Note that the expression levels of some regulators of G1/S checkpoint in MM01 were affected, but collectively, change of this group of genes remain statistically insignificant (p = 0.084). (C) Validation of the upregulation of selected genes in MM01 cells. Representative genes identified to be upregulated by microarray analysis were picked up for further validation. Levels of mRNA were determined by qRT-PCR. RNA samples isolated from Hep3B cells cultured in complete media were used as control, and mRNA levels in the control sample were arbitrarily defined as 1.
None
Figure 4. States of ER-stress signaling pathways under Gln- and Glc-depleted cells. Changes of ER-stress signaling pathways were generated by IPA. Three transcription factors, ATF4, ATF6 and XBP1, have been reported to play critical roles in ER-stress response. Activation of PERK leads to phosphorylation of eIF2α, hence translationally activating ATF4. ER stress also activates IRE1, which facilitates the splicing of XBP1 RNA. Grey-filled factors indicate no significant change; red filled activated; green filled inhibited and non-filled factors not covered in the data set analyzed. (A) Functional states of ER-stress signaling pathways in Gln-depleted cells. (B) Functional states of ER-stress signaling pathways in Glc-depleted cells.
None
Figure 5. Distinct metabolic roles of Glc and Gln in cell proliferation. Glc utilization provides cells with ATP, NADPH and carbon metabolites, which fulfill the major needs of energy, reducing power and carbon skeletons for anabolic activities. Gln is a substrate for the synthesis of Asn and nucleotides. It also serves as a precursor of Glu, which cannot be taken by cells efficiently. Glu serves as a central hub of nitrogen storage and redistribution, amino groups from other amino acids can be transferred to α-KG to form Glu. On the other hand, Glu serves as a major donor of amino group in the biosynthesis of other non-essential amino acids. In addition, Glu also serves as substrate for the synthesis of proteins, nucleotides, glutathione, polyamine and other nitrogenous molecules. Maintaining a relatively high intracellular concentration of Glu is also important for cells to uptake other nutrients; for example, the release of Glu down the concentration gradient provides the energy for cells to uptake cystine. Finally, the carbon skeleton of Gln or Glu may be eventually utilized by cells as a carbon source. Gln and Glc utilization work together to facilitate the biosynthesis of nitrogenous biomolecules.

References

    1. Dang CV. Glutaminolysis: supplying carbon or nitrogen or both for cancer cells? Cell Cycle. 2010;9:3884–6. doi: 10.4161/cc.9.19.13302. - DOI - PubMed
    1. Dang CV, Hamaker M, Sun P, Le A, Gao P. Therapeutic targeting of cancer cell metabolism. J Mol Med (Berl) 2011;89:205–12. doi: 10.1007/s00109-011-0730-x. - DOI - PMC - PubMed
    1. Yin C, Qie S, Sang N. Carbon source metabolism and its regulation in cancer cells. Crit Rev Eukaryot Gene Expr. 2012;22:17–35. doi: 10.1615/CritRevEukarGeneExpr.v22.i1.20. - DOI - PMC - PubMed
    1. Liang D, Kong X, Sang N. Effects of histone deacetylase inhibitors on HIF-1. Cell Cycle. 2006;5:2430–5. doi: 10.4161/cc.5.21.3409. - DOI - PMC - PubMed
    1. Sang N, Fang J, Srinivas V, Leshchinsky I, Caro J. Carboxyl-terminal transactivation activity of hypoxia-inducible factor 1 alpha is governed by a von Hippel-Lindau protein-independent, hydroxylation-regulated association with p300/CBP. Mol Cell Biol. 2002;22:2984–92. doi: 10.1128/MCB.22.9.2984-2992.2002. - DOI - PMC - PubMed

Publication types

LinkOut - more resources