

Live-cell subcellular measurement of cell stiffness using a microengineered stretchable micropost array membrane
- PMID: 22935822
- PMCID: PMC4088946
- DOI: 10.1039/c2ib20134h
Live-cell subcellular measurement of cell stiffness using a microengineered stretchable micropost array membrane
Abstract
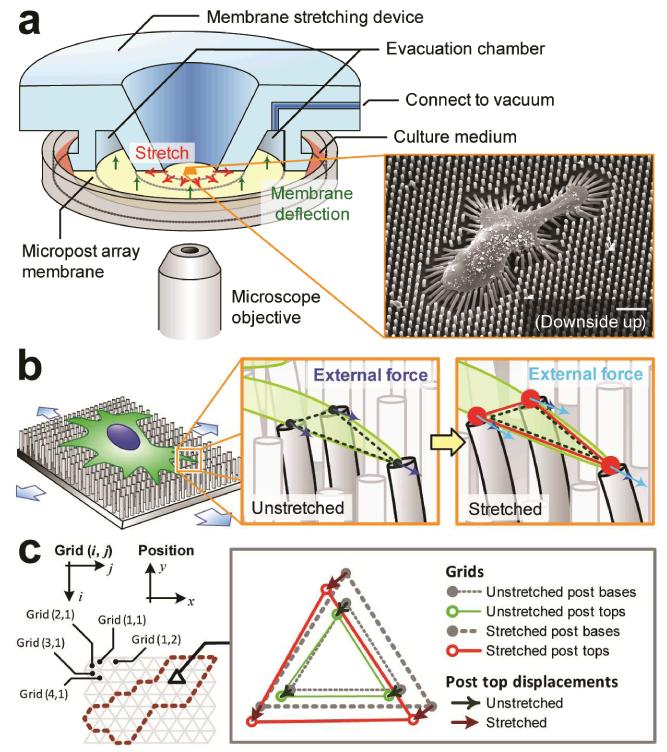
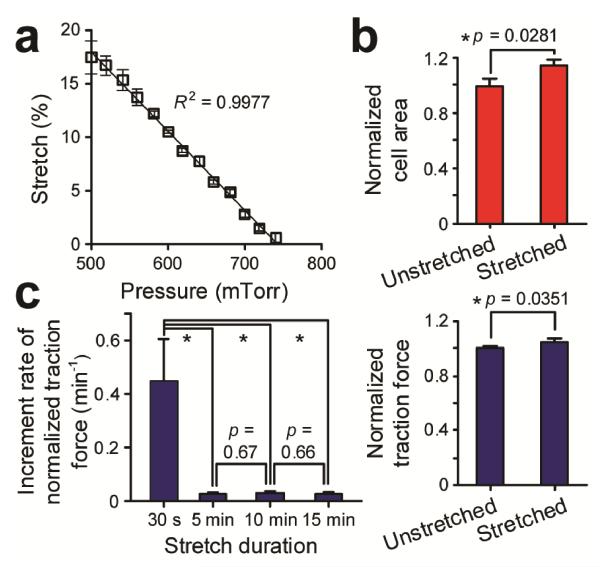
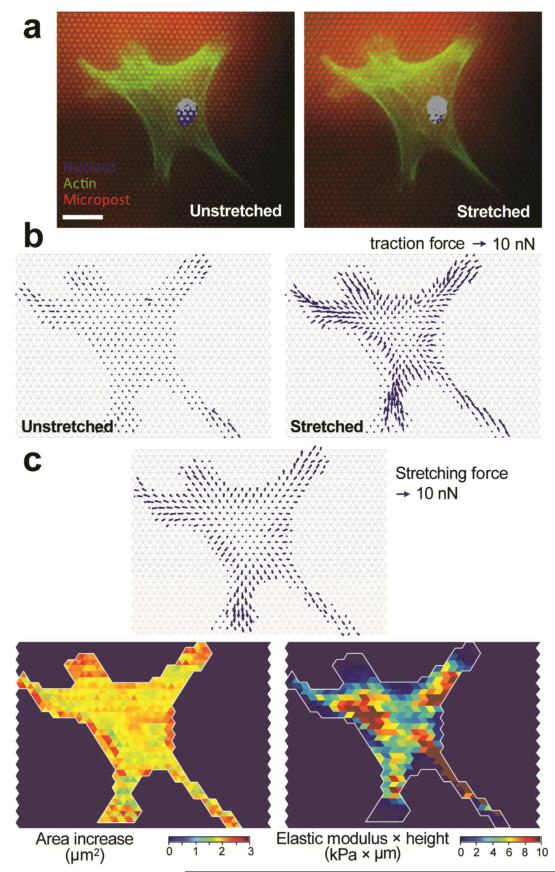
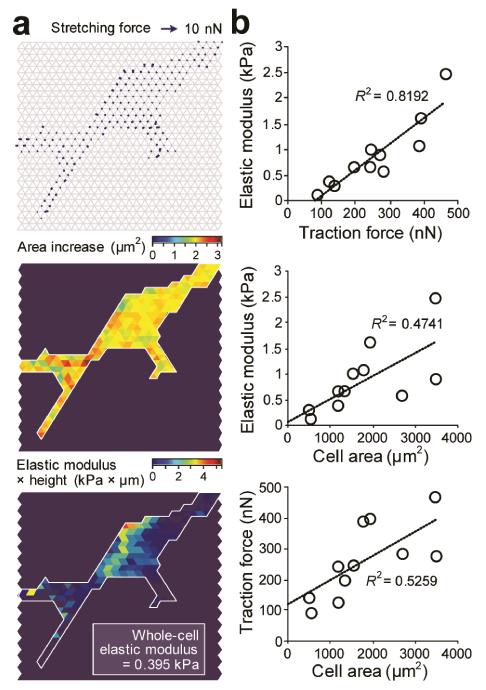
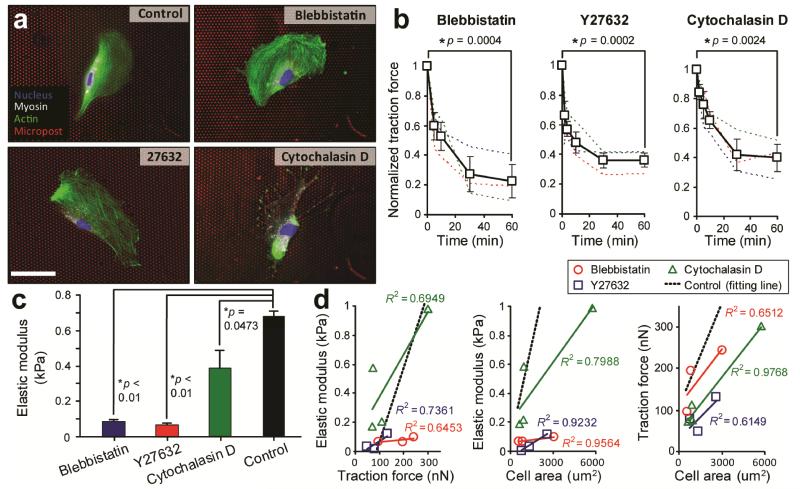
Forces are increasingly recognized as major regulators of cell structure and function, and the mechanical properties of cells, such as cell stiffness, are essential to the mechanisms by which cells sense forces, transmit them to the cell interior or to other cells, and transduce them into chemical signals that impact a spectrum of cellular responses. Here we reported a new whole-cell cell stiffness measurement technique with a subcellular spatial resolution. This technique was based on a novel cell stretching device that allowed for quantitative control and real-time measurements of mechanical stimuli and cellular biomechanical responses. Our strategy involved a microfabricated array of silicone elastomeric microposts integrated onto a stretchable elastomeric membrane. Using a computer-controlled vacuum, this micropost array membrane (mPAM) was activated to apply equibiaxial cell stretching forces to adherent cells attached on the tops of the microposts. The micropost top positions before and after mPAM stretches were recorded using fluorescence microscopy and further utilized to quantify local cell stretching forces and cell area increments. A robust computation scheme was developed and implemented for subcellular quantifications of cell stiffness using the data of local cell stretching forces and cell area increments generated from mPAM cell stretch assays. Our cell stiffness studies using the mPAM revealed strong positive correlations among cell stiffness, cellular traction force, and cell spread area, and illustrated the important functional roles of actin polymerization and myosin II-mediated cytoskeleton contractility in regulating cell stiffness. Collectively, our work reported a new approach for whole-cell stiffness measurements with a subcellular spatial resolution, which would help likely explain the complex biomechanical functions and force-sensing mechanisms of cells and design better materials for cell and tissue engineering and other applications in vivo.
Figures
Similar articles
-
A silicone-based stretchable micropost array membrane for monitoring live-cell subcellular cytoskeletal response.Lab Chip. 2012 Feb 21;12(4):731-40. doi: 10.1039/c2lc20896b. Epub 2011 Dec 23. Lab Chip. 2012. PMID: 22193351 Free PMC article.
-
Simulation of the mechanical response of cells on micropost substrates.J Biomech Eng. 2013 Oct;135(10):101012. doi: 10.1115/1.4025114. J Biomech Eng. 2013. PMID: 23896758
-
Time-dependent changes in smooth muscle cell stiffness and focal adhesion area in response to cyclic equibiaxial stretch.Ann Biomed Eng. 2008 Mar;36(3):369-80. doi: 10.1007/s10439-008-9438-7. Epub 2008 Jan 24. Ann Biomed Eng. 2008. PMID: 18214679
-
Cell mechanics: integrating cell responses to mechanical stimuli.Annu Rev Biomed Eng. 2007;9:1-34. doi: 10.1146/annurev.bioeng.9.060906.151927. Annu Rev Biomed Eng. 2007. PMID: 17461730 Review.
-
Molecular Tension Probes for Imaging Forces at the Cell Surface.Acc Chem Res. 2017 Dec 19;50(12):2915-2924. doi: 10.1021/acs.accounts.7b00305. Epub 2017 Nov 21. Acc Chem Res. 2017. PMID: 29160067 Free PMC article. Review.
Cited by
-
Form-finding model shows how cytoskeleton network stiffness is realized.PLoS One. 2013 Oct 17;8(10):e77417. doi: 10.1371/journal.pone.0077417. eCollection 2013. PLoS One. 2013. PMID: 24146992 Free PMC article.
-
Stiffness versus prestress relationship at subcellular length scale.J Biomech. 2014 Sep 22;47(12):3222-5. doi: 10.1016/j.jbiomech.2014.08.004. Epub 2014 Aug 7. J Biomech. 2014. PMID: 25138630 Free PMC article.
-
Engineered microenvironment for the study of myofibroblast mechanobiology.Wound Repair Regen. 2021 Jul;29(4):588-596. doi: 10.1111/wrr.12955. Epub 2021 Jun 22. Wound Repair Regen. 2021. PMID: 34118169 Free PMC article.
-
The role of mechanics in actin stress fiber kinetics.Exp Cell Res. 2013 Oct 1;319(16):2490-500. doi: 10.1016/j.yexcr.2013.06.017. Epub 2013 Jul 29. Exp Cell Res. 2013. PMID: 23906923 Free PMC article. Review.
-
Biomechanical Characterization at the Cell Scale: Present and Prospects.Front Physiol. 2018 Nov 15;9:1449. doi: 10.3389/fphys.2018.01449. eCollection 2018. Front Physiol. 2018. PMID: 30498449 Free PMC article. Review.
References
Publication types
MeSH terms
Substances
Grants and funding
LinkOut - more resources
Full Text Sources
Other Literature Sources
