. 2013 Jan;23(1):169-80.
doi: 10.1101/gr.139618.112. Epub 2012 Aug 30.

High-fidelity promoter profiling reveals widespread alternative promoter usage and transposon-driven developmental gene expression

Affiliations

High-fidelity promoter profiling reveals widespread alternative promoter usage and transposon-driven developmental gene expression

Philippe Batut et al. Genome Res. 2013 Jan.

Abstract

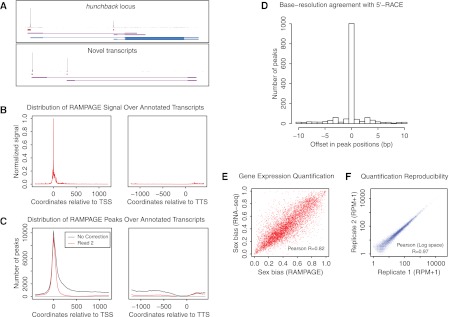
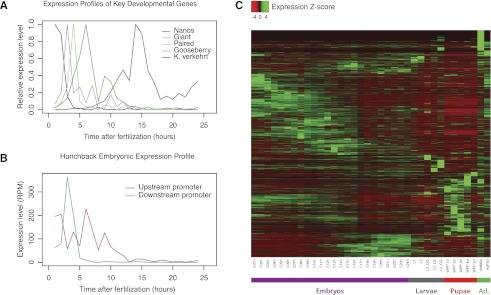
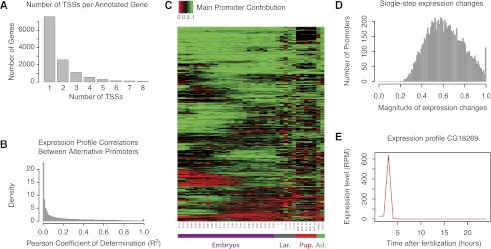
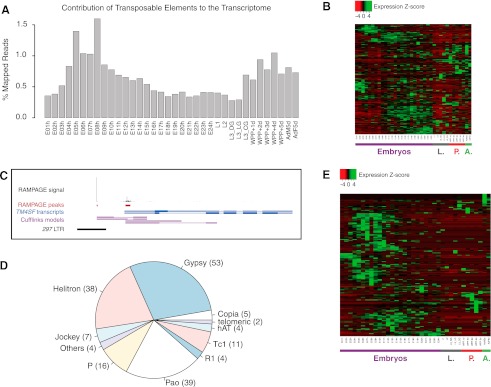
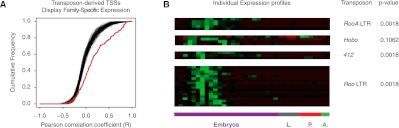
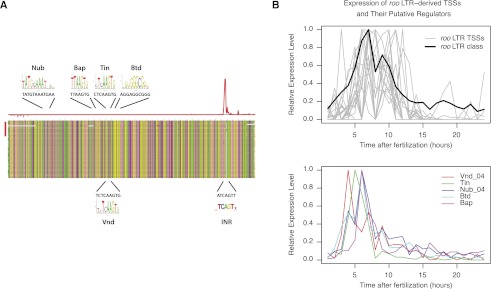
Many eukaryotic genes possess multiple alternative promoters with distinct expression specificities. Therefore, comprehensively annotating promoters and deciphering their individual regulatory dynamics is critical for gene expression profiling applications and for our understanding of regulatory complexity. We introduce RAMPAGE, a novel promoter activity profiling approach that combines extremely specific 5'-complete cDNA sequencing with an integrated data analysis workflow, to address the limitations of current techniques. RAMPAGE features a streamlined protocol for fast and easy generation of highly multiplexed sequencing libraries, offers very high transcription start site specificity, generates accurate and reproducible promoter expression measurements, and yields extensive transcript connectivity information through paired-end cDNA sequencing. We used RAMPAGE in a genome-wide study of promoter activity throughout 36 stages of the life cycle of Drosophila melanogaster, and describe here a comprehensive data set that represents the first available developmental time-course of promoter usage. We found that >40% of developmentally expressed genes have at least two promoters and that alternative promoters generally implement distinct regulatory programs. Transposable elements, long proposed to play a central role in the evolution of their host genomes through their ability to regulate gene expression, contribute at least 1300 promoters shaping the developmental transcriptome of D. melanogaster. Hundreds of these promoters drive the expression of annotated genes, and transposons often impart their own expression specificity upon the genes they regulate. These observations provide support for the theory that transposons may drive regulatory innovation through the distribution of stereotyped cis-regulatory modules throughout their host genomes.


Figures

Figure 1.
Figure 1.
RAMPAGE: specific, accurate, quantitative paired-end sequencing of 5′complete cDNAs. (A) Graphical representation of the data at the hunchback gene locus and at an unannotated locus harboring novel transcripts. For each panel, the top track shows the density of cDNA 5′ ends per position on the upper strand, which can be interpreted as a single base-resolution profile of transcription initiation activity. The second track represents the peaks (i.e., TSS clusters) called from that density profile. The third track shows the partial transcript models reconstructed ab initio from our sequencing data using Cufflinks. For the upper panel, the fourth track displays FlyBase transcript annotations. For the bottom panel, note that paired-end information allows one to infer a functional link between the two promoters, which appear to be alternative promoters for a common locus. (B) Metaprofile of signal density over all FlyBase r5.32 transcript annotations. (TSS) Transcription start site; (TTS) transcription termination site. (C) Metaprofile of peak density over annotated transcripts. (Red curve, downstream read coverage correction; black curve, no correction; all other peak-calling parameters were kept identical). (D) Histogram of the cross-correlation of TSS cluster positioning by RLM-RACE and by our method. For each cluster, we determined the positional offset (in base pairs) that maximizes the cross-correlation between the data from the two methods. (E) Comparison of RAMPAGE and standard RNA-seq performance for relative quantification of gene expression. We compared the measures of sex bias in the expression of genes obtained by the two methods. (F) Reproducibility of expression level measurements between biological replicates. ([RPM] Reads per million.)
Figure 2.
Figure 2.
RAMPAGE recapitulates known expression profiles and establishes genome-wide promoter activity dynamics. (A) Expression profiles of well-characterized key developmental genes during embryonic development. Note the sharpness of the profiles afforded by the high temporal resolution of the timecourse. (K. verkehrt indicates krotzkopf verkehrt.) (B) Differential expression of alternative promoters (hunchback locus). Our data fully recapitulate the expression pattern for hb that has been characterized in previous work (Schroder et al. 1988). The hb mRNAs transcribed from the upstream (maternal) promoter are predominant immediately after egg laying and decay rapidly as the downstream promoter starts being expressed, displaying maximal expression 2–3 h after egg laying. The upstream promoter is active again with a second peak at 5–6 h. (C) Heatmap representing the Z-score normalized expression profiles for the 24,264 promoters we could attribute to annotated genes based on cDNA structure.
Figure 3.
Figure 3.
Widespread differential regulation through alternative promoter usage and fast kinetics of regulatory transitions. (A) Number of TSSs detected per annotated gene. Over 40% of all expressed genes have at least two alternative TSSs. (A small number of genes are excluded from the graph [more than 10 TSSs], but these are probably affected by technical artifacts.) (B) Distribution of pairwise Pearson's coefficients of determination (R2) between the full expression profiles (36 timepoints) of alternative promoters. This gives a measure of the similarity between the expression profiles of alternative promoters. Only TSCs with a maximum expression level ≥10 RPM were included. Note the overall absence of correlation (median coefficient, 0.108). (C) Temporal dynamics of developmental transitions between alternative promoters. The heatmap represents the fraction of total expression contributed by the main promoter at each timepoint for 1295 genes that display pronounced transitions between promoters (see Methods). Note the diversity in the timing of promoter transitions. (D) Maximal fraction of the dynamic range of the profile of a given TSS spanned in a single hour during embryonic development (24 timepoints, 0–24 h). Median is 60.8%. Only genes whose expression range spans at least an order of magnitude and whose maximum expression level exceeds 10 RPM were considered in this analysis. (E) Example of a gene with fast transitions kinetics of high absolute magnitude.
Figure 4.
Figure 4.
Transposable elements display developmental regulation and provide TSSs for many host genes. (A) Contribution of transcription initiating within transposable elements to the developmental transcriptome. For each time point, we report the proportion of all mapped reads (aligned uniquely or to multiple locations) for which the 5′ end lies in an annotated transposon. (B) Z-score–normalized expression profiles for all annotated classes of transposable elements. Note the developmental regulation of virtually all classes, as well as the disparity of patterns across classes. (C) A 297 LTR provides a strong alternative promoter for the TM4SF gene. (D) Subfamilies of transposable elements providing TSSs for annotated genes. The number of TSCs for each subfamily is reported in brackets (total 182). (E) Z-score–normalized expression profiles for all transposon-derived genic TSCs. The diversity of expression profiles underscores the versatility of transposons as regulatory modules.
Figure 5.
Figure 5.
Transposons impart their own expression specificity upon the genes they regulate. (A) Cumulative distribution of pairwise Pearson correlation coefficients (R) between individual transposon-derived TSCs and the class of TEs they are derived from (red curve). This measures the similarity between the expression profile of a given gene-driving insertion and the overall profile of the class it belongs to. The black curves show 100 simulations in which the TSS-transposon class pairs were randomized. Permutation test (10,000 randomizations) P = 0.0001. (B) Z-score-normalized expression profiles for individual subfamilies of transposons. Bonferroni-corrected P-values from permutation tests quantify the significance of the similarity between each group of TSCs and its cognate class profile. Note that 0.0018 is the limit of the power of the statistical tests.
Figure 6.
Figure 6.
Core promoters and cis-regulatory elements in transposable elements: roo LTRs. (A) Multiple alignment of the sequences of the 18 LTRs providing TSCs for host genes (red bar on the left) to the roo consensus (upper sequence) and to a set of full-length LTRs with high similarity to the class consensus. The histogram above shows the density of tags on the upper (red) and lower (gray) strands. The positions of various sequence motifs are depicted, along with the logo of the known motif and the actual consensus sequence of the LTR. The TFBSs for NUB and BAP and the Initiator sequence (INR) are on the upper strand; the TFBSs for TIN, VND, and BTD are on the lower strand. (B) Expression profiles of the genes encoding putative regulators of roo LTRs. nub and vnd have more than one TSS, and only the one with the expression profile most consistent with roo LTRs is shown.

References

    1. Bejerano G, Lowe CB, Ahituv N, King B, Siepel A, Salama SR, Rubin EM, Kent WJ, Haussler D 2006. A distal enhancer and an ultraconserved exon are derived from a novel retroposon. Nature 441: 87–90 - PubMed
    1. Bourque G 2009. Transposable elements in gene regulation and in the evolution of vertebrate genomes. Curr Opin Genet Dev 19: 607–612 - PubMed
    1. Bourque G, Leong B, Vega VB, Chen X, Lee YL, Srinivasan KG, Chew JL, Ruan Y, Wei CL, Ng HH, et al. 2008. Evolution of the mammalian transcription factor binding repertoire via transposable elements. Genome Res 18: 1752–1762 - PMC - PubMed
    1. Britten RJ, Davidson EH 1969. Gene regulation for higher cells: A theory. Science 165: 349–357 - PubMed
    1. Bronner G, Taubert H, Jackle H 1995. Mesoderm-specific B104 expression in the Drosophila embryo is mediated by internal cis-acting elements of the transposon. Chromosoma 103: 669–675 - PubMed

Publication types

Substances

Associated data