

A second-generation assembly of the Drosophila simulans genome provides new insights into patterns of lineage-specific divergence
- PMID: 22936249
- PMCID: PMC3530686
- DOI: 10.1101/gr.141689.112
A second-generation assembly of the Drosophila simulans genome provides new insights into patterns of lineage-specific divergence
Abstract
We create a new assembly of the Drosophila simulans genome using 142 million paired short-read sequences and previously published data for strain w(501). Our assembly represents a higher-quality genomic sequence with greater coverage, fewer misassemblies, and, by several indexes, fewer sequence errors. Evolutionary analysis of this genome reference sequence reveals interesting patterns of lineage-specific divergence that are different from those previously reported. Specifically, we find that Drosophila melanogaster evolves faster than D. simulans at all annotated classes of sites, including putatively neutrally evolving sites found in minimal introns. While this may be partly explained by a higher mutation rate in D. melanogaster, we also find significant heterogeneity in rates of evolution across classes of sites, consistent with historical differences in the effective population size for the two species. Also contrary to previous findings, we find that the X chromosome is evolving significantly faster than autosomes for nonsynonymous and most noncoding DNA sites and significantly slower for synonymous sites. The absence of a X/A difference for putatively neutral sites and the robustness of the pattern to Gene Ontology and sex-biased expression suggest that partly recessive beneficial mutations may comprise a substantial fraction of noncoding DNA divergence observed between species. Our results have more general implications for the interpretation of evolutionary analyses of genomes of different quality.
Figures
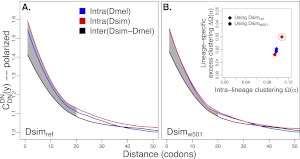
 (the correlation in divergence between nonsynonymous substitutions) decreases with increasing distance separating two nonsynonymous substitutions, specific to the lineage from which the substitution arose (polarized), following Figure 4A of Callahan et al. (2011). The amount of intralineage clustering within D. simulans (red line) and D. melanogaster (blue line) relative to interlineage clustering (black line) is shown separately for the two D. simulans assemblies: Dsimref (A); Dsimw501 (B). The excess of intralineage relative to interlineage clustering in D. simulans is represented by the area between the red and blue curves for the first 20 codons [
 , shaded in gray]. Note that the same set of genes from both assemblies is analyzed, and D. simulans orthologs from either assembly containing a premature stop codon or non-start or stop codons are excluded. (B) Unlike the pattern from Dsimref, a similar amount of intralineage clustering is found in both the D. simulans and D. melanogaster lineages when using Dsimw501 (greater overlap between blue and red lines; shaded region in gray is smaller). The intralineage clustering excess
  relative to the extent of intralineage clustering
  is shown in the inset (following Fig. 4B of Callahan et al. 2011). A considerably larger intralineage clustering excess is found in the D. simulans lineage when using Dsimref, which is also circled in the inset.
References
-
- Andolfatto P 2001. Contrasting patterns of X-linked and autosomal nucleotide variation in Drosophila melanogaster and Drosophila simulans. Mol Biol Evol 18: 279–290 - PubMed
Publication types
MeSH terms
Grants and funding
LinkOut - more resources
Full Text Sources
Other Literature Sources
Molecular Biology Databases