

Antitumor T-cell responses contribute to the effects of dasatinib on c-KIT mutant murine mastocytoma and are potentiated by anti-OX40
- PMID: 22936666
- PMCID: PMC3512233
- DOI: 10.1182/blood-2012-02-407163
Antitumor T-cell responses contribute to the effects of dasatinib on c-KIT mutant murine mastocytoma and are potentiated by anti-OX40
Abstract
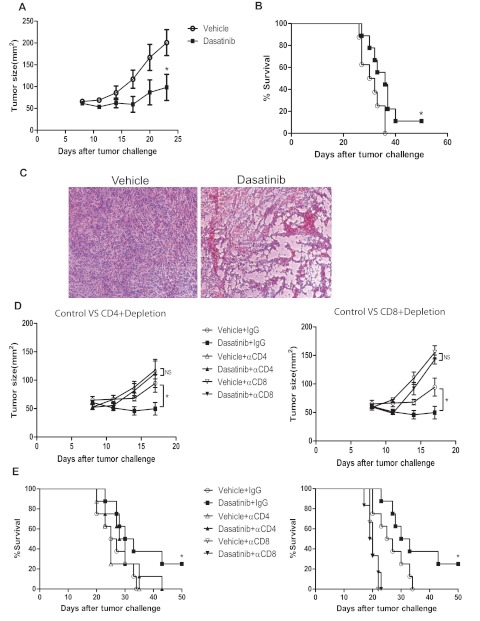
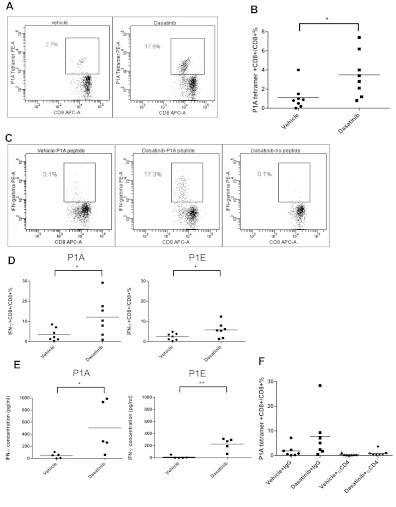
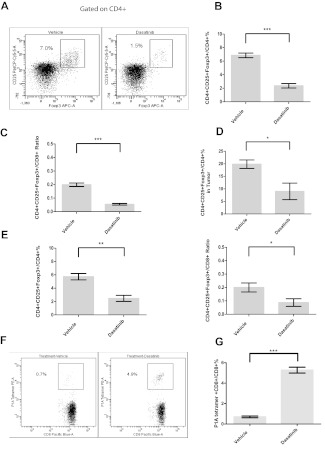
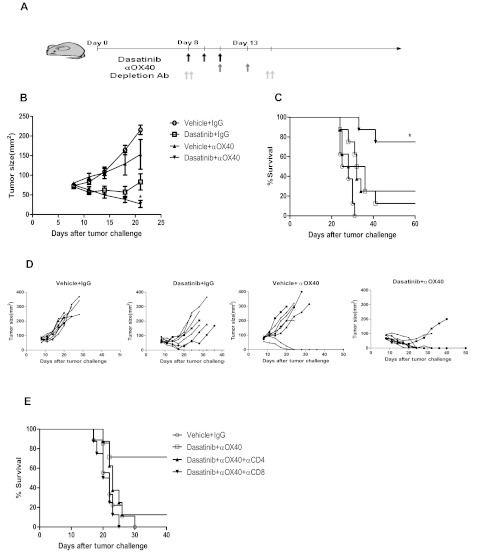
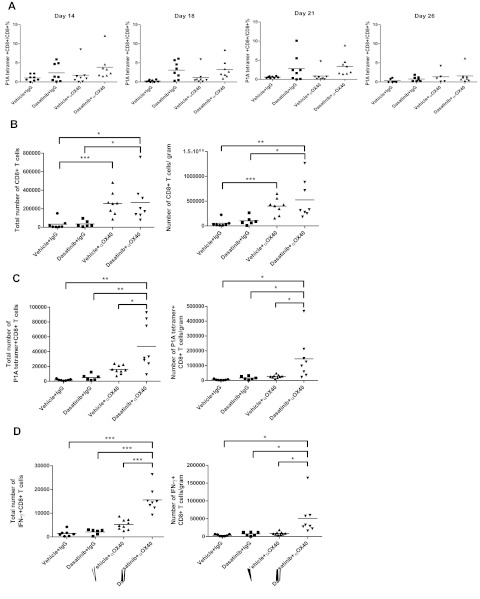
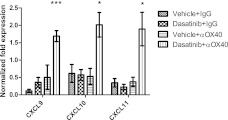
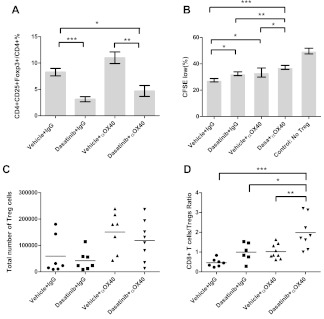
Targeted and immune-based therapies are thought to eradicate cancer cells by different mechanisms, and these approaches could possibly complement each other when used in combination. In this study, we report that the in vivo antitumor effects of the c-KIT inhibitor, dasatinib, on the c-KIT mutant P815 mastocytoma tumor were substantially dependent on T cell-mediated immunity. We found that dasatinib treatment significantly decreased levels of Tregs while specifically enhancing tumor antigen-specific T-cell responses. We sought to further enhance this therapy with the addition of anti-OX40 antibody, which is known to provide a potent costimulatory signal to T cells. The combination of dasatinib and anti-OX40 antibody resulted in substantially better therapeutic efficacy compared with either drug alone, and this was associated with enhanced accumulation of tumor antigen-specific T cells in the tumor microenvironment. Furthermore, the combination regimen inhibited the function of Tregs and also resulted in significantly up-regulated expression of the IFN-γ-induced chemokines CXCL9, 10, and 11 in the tumor microenvironment, which provides a feasible mechanism for the enhanced intratumoral CTL infiltration. These studies delineate a strategy by which targeted therapy and immunotherapy may be combined to achieve superior antitumor responses in cancer patients.
Figures
Comment in
-
Immunobiology. Combined targeted and immunotherapy: the future of personalized medicine.Blood. 2012 Nov 29;120(23):4454-5. doi: 10.1182/blood-2012-09-455105. Blood. 2012. PMID: 23197581
Similar articles
-
Immunobiology. Combined targeted and immunotherapy: the future of personalized medicine.Blood. 2012 Nov 29;120(23):4454-5. doi: 10.1182/blood-2012-09-455105. Blood. 2012. PMID: 23197581
-
The Src and c-Kit kinase inhibitor dasatinib enhances p53-mediated targeting of human acute myeloid leukemia stem cells by chemotherapeutic agents.Blood. 2013 Sep 12;122(11):1900-13. doi: 10.1182/blood-2012-11-466425. Epub 2013 Jul 29. Blood. 2013. PMID: 23896410 Free PMC article.
-
Simultaneous inhibition of two regulatory T-cell subsets enhanced Interleukin-15 efficacy in a prostate tumor model.Proc Natl Acad Sci U S A. 2012 Apr 17;109(16):6187-92. doi: 10.1073/pnas.1203479109. Epub 2012 Apr 2. Proc Natl Acad Sci U S A. 2012. PMID: 22474386 Free PMC article.
-
The role of p27(Kip1) in dasatinib-enhanced paclitaxel cytotoxicity in human ovarian cancer cells.J Natl Cancer Inst. 2011 Sep 21;103(18):1403-22. doi: 10.1093/jnci/djr280. Epub 2011 Aug 2. J Natl Cancer Inst. 2011. PMID: 21813412 Free PMC article.
-
Impact of tumour microenvironment and Fc receptors on the activity of immunomodulatory antibodies.Trends Immunol. 2014 Jul;35(7):290-8. doi: 10.1016/j.it.2014.05.002. Epub 2014 Jun 18. Trends Immunol. 2014. PMID: 24953012 Review.
Cited by
-
Resistance to c-Kit inhibitors in melanoma: insights for future therapies.Oncoscience. 2014 Jun 6;1(6):423-6. doi: 10.18632/oncoscience.51. eCollection 2014. Oncoscience. 2014. PMID: 25594040 Free PMC article.
-
Innate T-αβ lymphocytes as new immunological components of anti-tumoral "off-target" effects of the tyrosine kinase inhibitor dasatinib.Sci Rep. 2020 Feb 24;10(1):3245. doi: 10.1038/s41598-020-60195-z. Sci Rep. 2020. PMID: 32094501 Free PMC article. Clinical Trial.
-
Chemotherapeutic targeting of cancer-induced immunosuppressive cells.Cancer Res. 2014 May 15;74(10):2663-8. doi: 10.1158/0008-5472.CAN-14-0301. Epub 2014 Apr 28. Cancer Res. 2014. PMID: 24778417 Free PMC article. Review.
-
Sulindac, a non-steroidal anti-inflammatory drug, mediates breast cancer inhibition as an immune modulator.Sci Rep. 2016 Jan 18;6:19534. doi: 10.1038/srep19534. Sci Rep. 2016. PMID: 26777116 Free PMC article.
-
One step further in targeting acute leukemia by combining antibody-based immunotherapies and small molecule inhibitors.Cancer Cell Int. 2025 Jul 7;25(1):254. doi: 10.1186/s12935-025-03869-w. Cancer Cell Int. 2025. PMID: 40624659 Free PMC article. Review.
References
-
- Bickenbach K, Wilcox R, Veerapong J, et al. A review of resistance patterns and phenotypic changes in gastrointestinal stromal tumors following imatinib mesylate therapy. J Gastrointest Surg. 2007;11(6):758–766. - PubMed
-
- Rini BI, Atkins MB. Resistance to targeted therapy in renal-cell carcinoma. Lancet Oncol. 2009;10(10):992–1000. - PubMed
-
- Smalley KS. PLX-4032, a small-molecule B-Raf inhibitor for the potential treatment of malignant melanoma. Curr Opin Investig Drugs. 2010;11(6):699–706. - PubMed
-
- Lennartsson J, Ronnstrand L. The stem cell factor receptor/c-Kit as a drug target in cancer. Current Cancer Drug Targets. 2006;6(1):65–75. - PubMed
Publication types
MeSH terms
Substances
Grants and funding
LinkOut - more resources
Full Text Sources
Other Literature Sources
Molecular Biology Databases
Research Materials
