

Divergent skeletal muscle respiratory capacities in rats artificially selected for high and low running ability: a role for Nor1?
- PMID: 22936731
- PMCID: PMC3524666
- DOI: 10.1152/japplphysiol.00788.2012
Divergent skeletal muscle respiratory capacities in rats artificially selected for high and low running ability: a role for Nor1?
Abstract
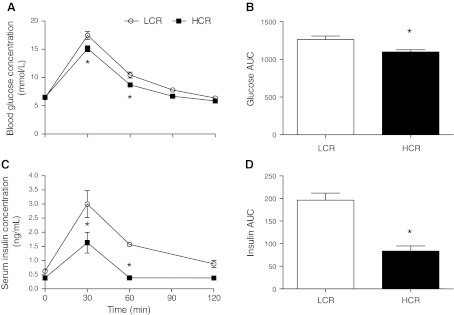
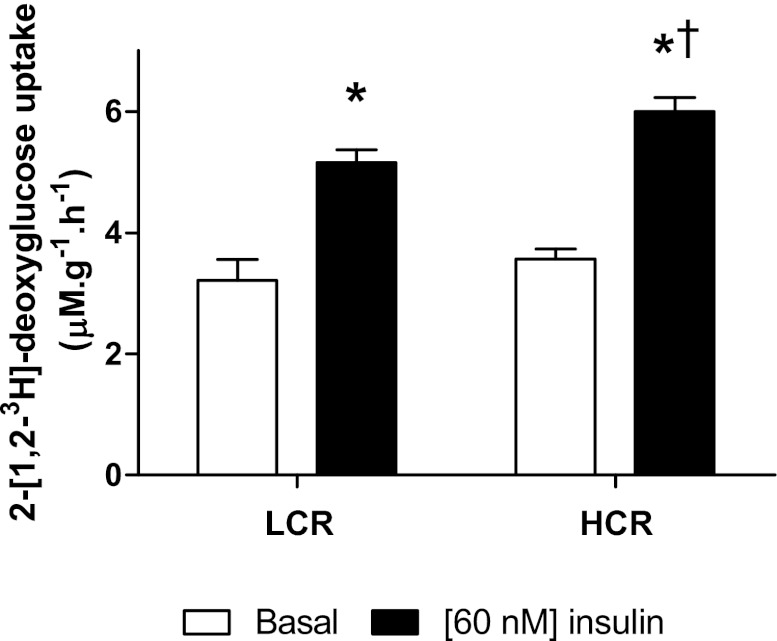
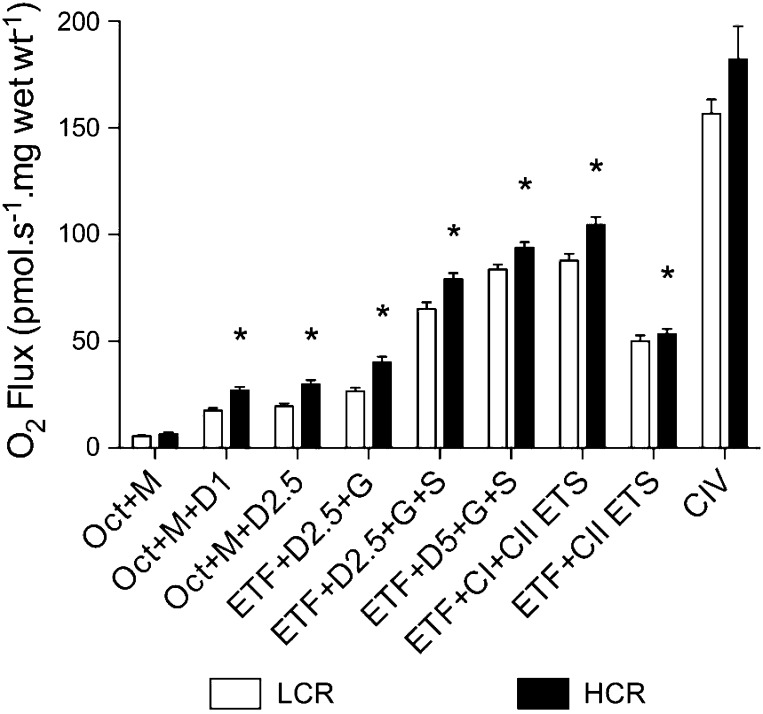
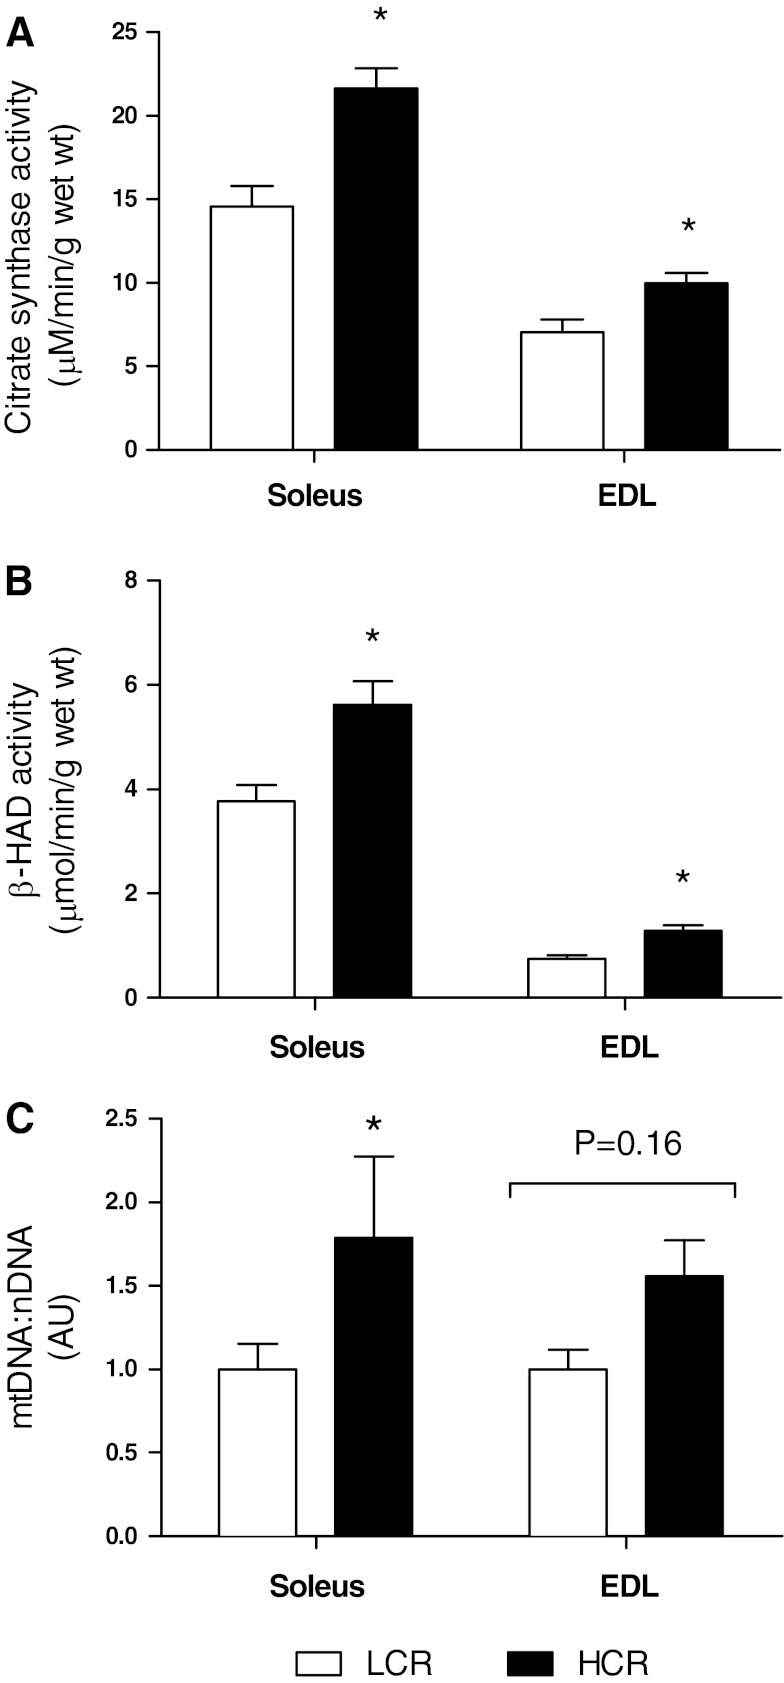
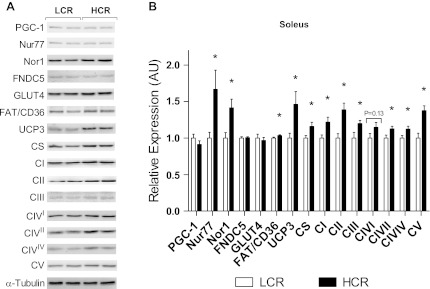
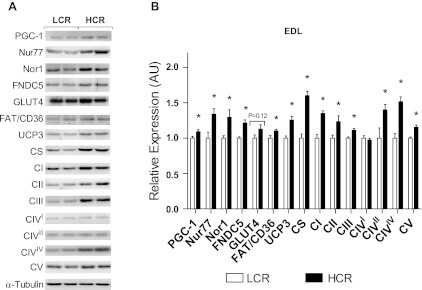
Inactivity-related diseases are becoming a huge burden on Western society. While there is a major environmental contribution to metabolic health, the intrinsic properties that predispose or protect against particular health traits are harder to define. We used rat models of inborn high running capacity (HCR) and low running capacity (LCR) to determine inherent differences in mitochondrial volume and function, hypothesizing that HCR rats would have greater skeletal muscle respiratory capacity due to an increase in mitochondrial number. Additionally, we sought to determine if there was a link between the expression of the orphan nuclear receptor neuron-derived orphan receptor (Nor)1, a regulator of oxidative metabolism, and inherent skeletal muscle respiratory capacity. LCR rats were 28% heavier (P < 0.0001), and fasting serum insulin concentrations were 62% greater than in HCR rats (P = 0.02). In contrast, HCR rats had better glucose tolerance and reduced adiposity. In the primarily oxidative soleus muscle, maximal respiratory capacity was 21% greater in HCR rats (P = 0.001), for which the relative contribution of fat oxidation was 20% higher than in LCR rats (P = 0.02). This was associated with increased citrate synthase (CS; 33%, P = 0.009) and β-hydroxyacyl-CoA (β-HAD; 33%, P = 0.0003) activities. In the primarily glycolytic extensor digitum longus muscle, CS activity was 29% greater (P = 0.01) and β-HAD activity was 41% (P = 0.0004) greater in HCR rats compared with LCR rats. Mitochondrial DNA copy numbers were also elevated in the extensor digitum longus muscles of HCR rats (35%, P = 0.049) and in soleus muscles (44%, P = 0.16). Additionally, HCR rats had increased protein expression of individual mitochondrial respiratory complexes, CS, and uncoupling protein 3 in both muscle types (all P < 0.05). In both muscles, Nor1 protein was greater in HCR rats compared with LCR rats (P < 0.05). We propose that the differential expression of Nor1 may contribute to the differences in metabolic regulation between LCR and HCR phenotypes.
Figures
Similar articles
-
Exercise training enhances white adipose tissue metabolism in rats selectively bred for low- or high-endurance running capacity.Am J Physiol Endocrinol Metab. 2013 Aug 1;305(3):E429-38. doi: 10.1152/ajpendo.00544.2012. Epub 2013 Jun 11. Am J Physiol Endocrinol Metab. 2013. PMID: 23757406 Free PMC article.
-
Skeletal muscle mitochondrial and metabolic responses to a high-fat diet in female rats bred for high and low aerobic capacity.Appl Physiol Nutr Metab. 2010 Apr;35(2):151-62. doi: 10.1139/H09-139. Appl Physiol Nutr Metab. 2010. PMID: 20383225 Free PMC article.
-
Lower oxidative DNA damage despite greater ROS production in muscles from rats selectively bred for high running capacity.Am J Physiol Regul Integr Comp Physiol. 2011 Mar;300(3):R544-53. doi: 10.1152/ajpregu.00250.2010. Epub 2010 Dec 9. Am J Physiol Regul Integr Comp Physiol. 2011. PMID: 21148474 Free PMC article.
-
Systemic oxygen transport in rats artificially selected for running endurance.Respir Physiol Neurobiol. 2006 Apr 28;151(2-3):141-50. doi: 10.1016/j.resp.2005.09.012. Epub 2005 Dec 15. Respir Physiol Neurobiol. 2006. PMID: 16344008 Review.
-
Comprehensive insights into the function and molecular and pharmacological regulation of neuron-derived orphan receptor 1, an orphan receptor.Front Pharmacol. 2022 Aug 30;13:981490. doi: 10.3389/fphar.2022.981490. eCollection 2022. Front Pharmacol. 2022. PMID: 36110555 Free PMC article. Review.
Cited by
-
Differential skeletal muscle proteome of high- and low-active mice.J Appl Physiol (1985). 2014 Apr 15;116(8):1057-67. doi: 10.1152/japplphysiol.00911.2013. Epub 2014 Feb 6. J Appl Physiol (1985). 2014. PMID: 24505100 Free PMC article.
-
Exercise-induced irisin in bone and systemic irisin administration reveal new regulatory mechanisms of bone metabolism.Bone Res. 2017 Feb 21;5:16056. doi: 10.1038/boneres.2016.56. eCollection 2017. Bone Res. 2017. PMID: 28944087 Free PMC article.
-
Targeting Orphan Nuclear Receptors NR4As for Energy Homeostasis and Diabetes.Front Pharmacol. 2020 Nov 27;11:587457. doi: 10.3389/fphar.2020.587457. eCollection 2020. Front Pharmacol. 2020. PMID: 33328994 Free PMC article. Review.
-
Exercise training enhances white adipose tissue metabolism in rats selectively bred for low- or high-endurance running capacity.Am J Physiol Endocrinol Metab. 2013 Aug 1;305(3):E429-38. doi: 10.1152/ajpendo.00544.2012. Epub 2013 Jun 11. Am J Physiol Endocrinol Metab. 2013. PMID: 23757406 Free PMC article.
-
Effect of aerobic training on baseline expression of signaling and respiratory proteins in human skeletal muscle.Physiol Rep. 2018 Sep;6(17):e13868. doi: 10.14814/phy2.13868. Physiol Rep. 2018. PMID: 30198217 Free PMC article.
References
-
- Bergmeyer HU. Methods of Enzymatic Analysis. Weinheim: Verlag Chemie, 1974
-
- Bostrom P, Wu J, Jedrychowski MP, Korde A, Ye L, Lo JC, Rasbach KA, Bostrom EA, Choi JH, Long JZ, Kajimura S, Zingaretti MC, Vind BF, Tu H, Cinti S, Hojlund K, Gygi SP, Spiegelman BM. A PGC1-α-dependent myokine that drives brown-fat-like development of white fat and thermogenesis. Nature 481: 463–468, 2012 - PMC - PubMed
-
- Briand O, Helleboid-Chapman A, Ploton M, Hennuyer N, Carpentier R, Pattou F, Vandewalle B, Moerman E, Gmyr V, Kerr-Conte J, Eeckhoute J, Staels B, Lefebvre P. The nuclear orphan receptor Nur77 is a lipotoxicity sensor regulating glucose-induced insulin secretion in pancreatic beta-cells. Mol Endocrinol 26: 399–413, 2012 - PMC - PubMed
-
- Bruce CR, Anderson MJ, Carey AL, Newman DG, Bonen A, Kriketos AD, Cooney GJ, Hawley JA. Muscle oxidative capacity is a better predictor of insulin sensitivity than lipid status. J Clin Endocrinol Metab 88: 5444–5451, 2003 - PubMed
Publication types
MeSH terms
Substances
Grants and funding
LinkOut - more resources
Full Text Sources