

Coupling mechanical deformations and planar cell polarity to create regular patterns in the zebrafish retina
- PMID: 22936893
- PMCID: PMC3426565
- DOI: 10.1371/journal.pcbi.1002618
Coupling mechanical deformations and planar cell polarity to create regular patterns in the zebrafish retina
Abstract
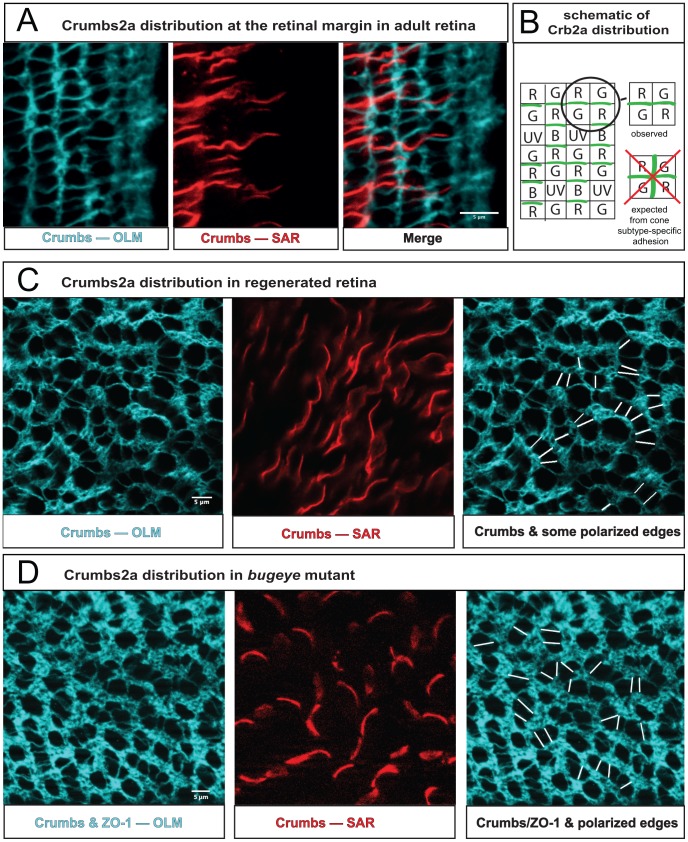
The orderly packing and precise arrangement of epithelial cells is essential to the functioning of many tissues, and refinement of this packing during development is a central theme in animal morphogenesis. The mechanisms that determine epithelial cell shape and position, however, remain incompletely understood. Here, we investigate these mechanisms in a striking example of planar order in a vertebrate epithelium: The periodic, almost crystalline distribution of cone photoreceptors in the adult teleost fish retina. Based on observations of the emergence of photoreceptor packing near the retinal margin, we propose a mathematical model in which ordered columns of cells form as a result of coupling between planar cell polarity (PCP) and anisotropic tissue-scale mechanical stresses. This model recapitulates many observed features of cone photoreceptor organization during retinal growth and regeneration. Consistent with the model's predictions, we report a planar-polarized distribution of Crumbs2a protein in cone photoreceptors in both unperturbed and regenerated tissue. We further show that the pattern perturbations predicted by the model to occur if the imposed stresses become isotropic closely resemble defects in the cone pattern in zebrafish lrp2 mutants, in which intraocular pressure is increased, resulting in altered mechanical stress and ocular enlargement. Evidence of interactions linking PCP, cell shape, and mechanical stresses has recently emerged in a number of systems, several of which show signs of columnar cell packing akin to that described here. Our results may hence have broader relevance for the organization of cells in epithelia. Whereas earlier models have allowed only for unidirectional influences between PCP and cell mechanics, the simple, phenomenological framework that we introduce here can encompass a broad range of bidirectional feedback interactions among planar polarity, shape, and stresses; our model thus represents a conceptual framework that can address many questions of importance to morphogenesis.
Conflict of interest statement
The authors have declared that no competing interests exist.
Figures
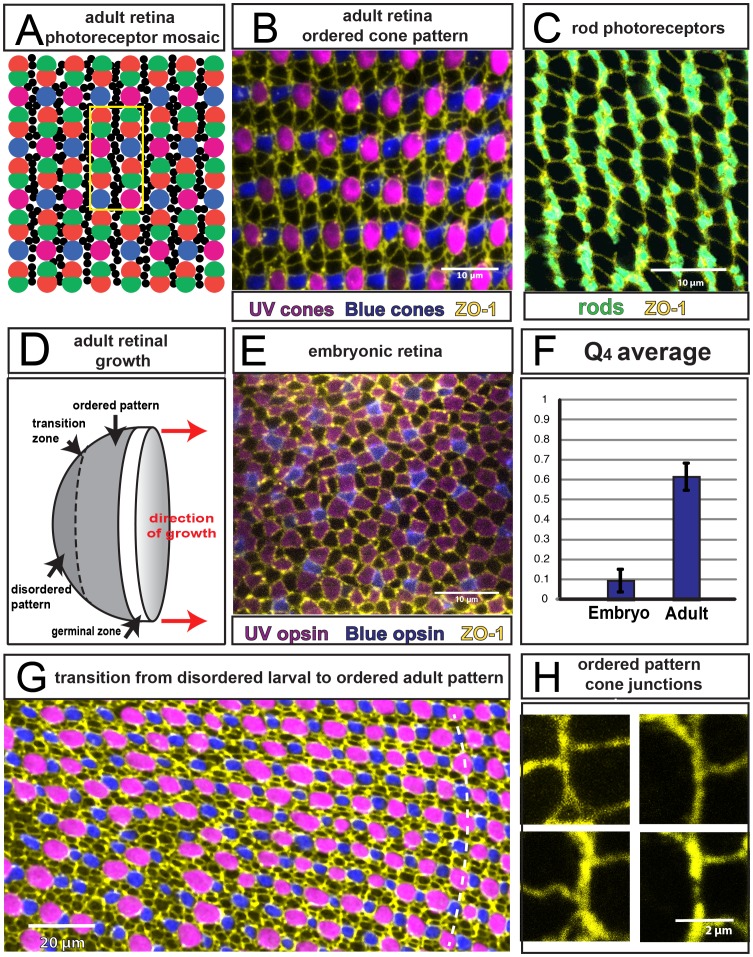
 (Fig. 2 and Methods) for embryonic and adult retina. (Three and six regions of ∼20 by 15 cone cells were used to calculate the values for embryonic and adult retina, respectively.) G) Transition from disordered cell packing in the larval remnant (left side) to ordered packing (right side) in a flat-mount retina of an adult double transgenic zebrafish, mi2009 labeling blue and UV (magenta) cones, with cell boundaries visualized with ZO-1 immunostaining (yellow). The curved, dashed line segment traces a cone column. H) High magnification views of the angles at which three cone-cone interfaces meet (ZO-1 in yellow).
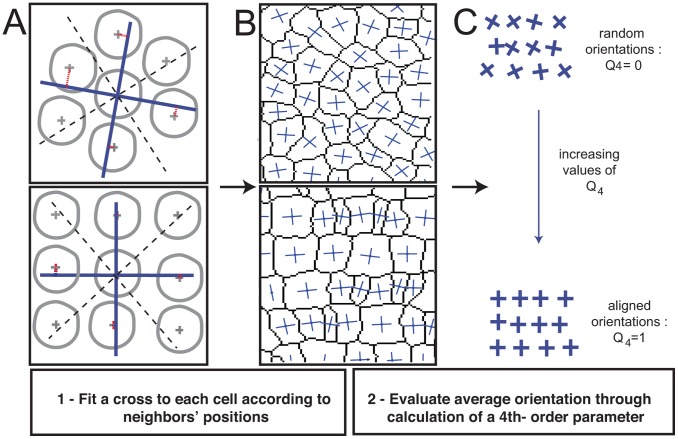
 ranges from 0 to 1 and increases as variability in the orientation of the crosses decreases. (See also Methods.)
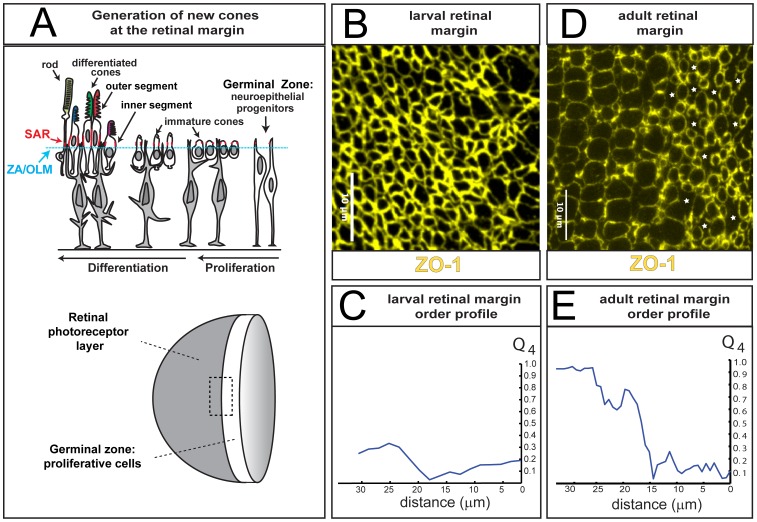
 orientational order parameter from the image in panel C; note that the value of
  increases sharply at the edge of the germinal zone (at ∼15 µm) in the adult retina.
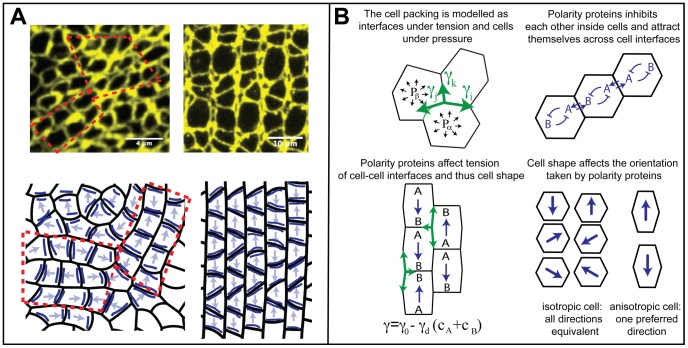
 and pressures
  ; tensions must balance at vertices in mechanical equilibrium (green arrows, top left). Proteins A and B define planar cell polarity (top right) and prefer to collect on shorter interfaces (bottom right). Interfacial tensions depend on polarity protein concentrations c (bottom left).
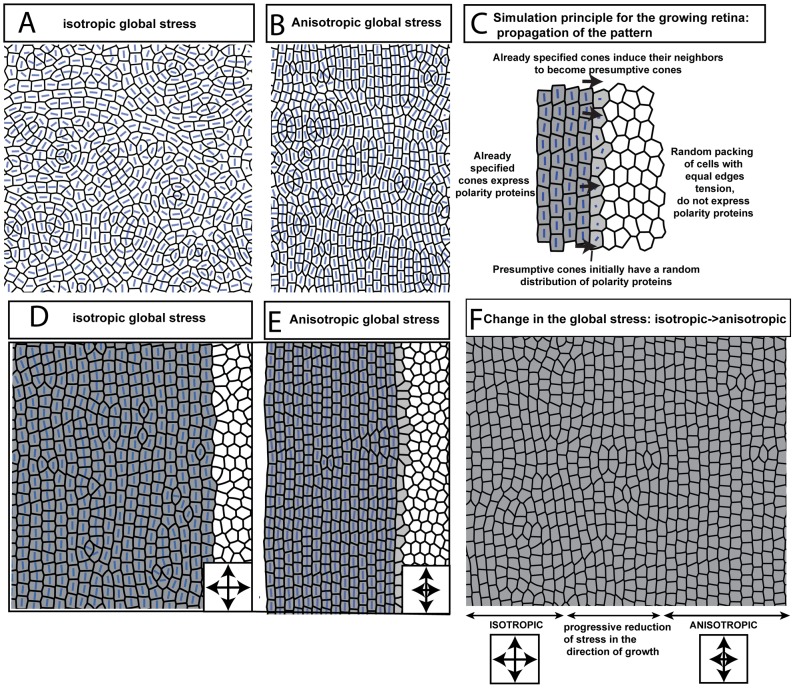
Similar articles
-
Anisotropic Müller glial scaffolding supports a multiplex lattice mosaic of photoreceptors in zebrafish retina.Neural Dev. 2017 Nov 15;12(1):20. doi: 10.1186/s13064-017-0096-z. Neural Dev. 2017. PMID: 29141686 Free PMC article.
-
Patterning the cone mosaic array in zebrafish retina requires specification of ultraviolet-sensitive cones.PLoS One. 2014 Jan 21;9(1):e85325. doi: 10.1371/journal.pone.0085325. eCollection 2014. PLoS One. 2014. PMID: 24465536 Free PMC article.
-
Identification of a non-canonical planar cell polarity pathway triggered by light in the developing mouse retina.Dev Cell. 2025 Feb 3;60(3):447-458.e5. doi: 10.1016/j.devcel.2024.10.012. Epub 2024 Nov 18. Dev Cell. 2025. PMID: 39561777
-
A moving wave patterns the cone photoreceptor mosaic array in the zebrafish retina.Int J Dev Biol. 2004;48(8-9):935-45. doi: 10.1387/ijdb.041873pr. Int J Dev Biol. 2004. PMID: 15558484 Review.
-
Zebrafish models of non-canonical Wnt/planar cell polarity signalling: fishing for valuable insight into vertebrate polarized cell behavior.Wiley Interdiscip Rev Dev Biol. 2017 May;6(3). doi: 10.1002/wdev.267. Epub 2017 Mar 17. Wiley Interdiscip Rev Dev Biol. 2017. PMID: 28304136 Review.
Cited by
-
Dynamic functional and structural remodeling during retinal regeneration in zebrafish.Front Mol Neurosci. 2022 Nov 30;15:1070509. doi: 10.3389/fnmol.2022.1070509. eCollection 2022. Front Mol Neurosci. 2022. PMID: 36533135 Free PMC article.
-
Emergent Tissue Shapes from the Regulatory Feedback between Morphogens and Cell Growth.bioRxiv [Preprint]. 2025 Feb 20:2025.02.16.638504. doi: 10.1101/2025.02.16.638504. bioRxiv. 2025. PMID: 40027769 Free PMC article. Preprint.
-
Timely neurogenesis drives the transition from nematic to crystalline nuclear packing during retinal morphogenesis.Sci Adv. 2025 May 9;11(19):eadu6843. doi: 10.1126/sciadv.adu6843. Epub 2025 May 9. Sci Adv. 2025. PMID: 40344072 Free PMC article.
-
Isolation of photoreceptors from mature, developing, and regenerated zebrafish retinas, and of microglia/macrophages from regenerating zebrafish retinas.Exp Eye Res. 2018 Dec;177:130-144. doi: 10.1016/j.exer.2018.08.002. Epub 2018 Aug 8. Exp Eye Res. 2018. PMID: 30096325 Free PMC article.
-
Junctional and cytoplasmic contributions in wound healing.J R Soc Interface. 2020 Aug;17(169):20200264. doi: 10.1098/rsif.2020.0264. Epub 2020 Aug 5. J R Soc Interface. 2020. PMID: 32752998 Free PMC article.
References
-
- Davidson LA (2008) Taming the tiger of tissue aggregation: how epithelia control structural assembly of underlying cells. Dev Cell 14: 152–154. - PubMed
-
- Lecuit T, Lenne PF (2007) Cell surface mechanics and the control of cell shape, tissue patterns and morphogenesis. Nat Rev Mol Cell Biol 8: 633–644. - PubMed
-
- Lecuit T, Lenne PF, Munro E (2010) Force Generation, Transmission, and Integration During Cell and Tissue Morphogenesis. Annu Rev Cell Dev Biol 27: 157–84. - PubMed
-
- Martin AC, Wieschaus EF (2010) Tensions divide. Nat Cell Biol 12: 5–7. - PubMed
Publication types
MeSH terms
LinkOut - more resources
Full Text Sources
Molecular Biology Databases
Miscellaneous
