

Decoding semantics across fMRI sessions with different stimulus modalities: a practical MVPA study
- PMID: 22936912
- PMCID: PMC3426793
- DOI: 10.3389/fninf.2012.00024
Decoding semantics across fMRI sessions with different stimulus modalities: a practical MVPA study
Abstract
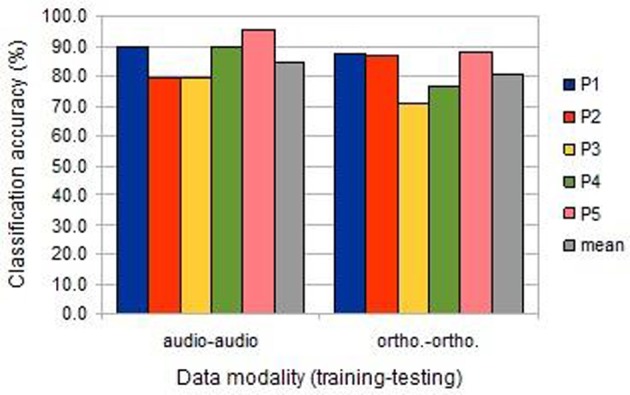
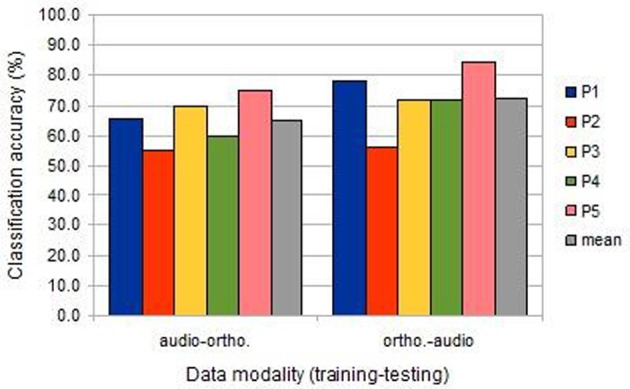
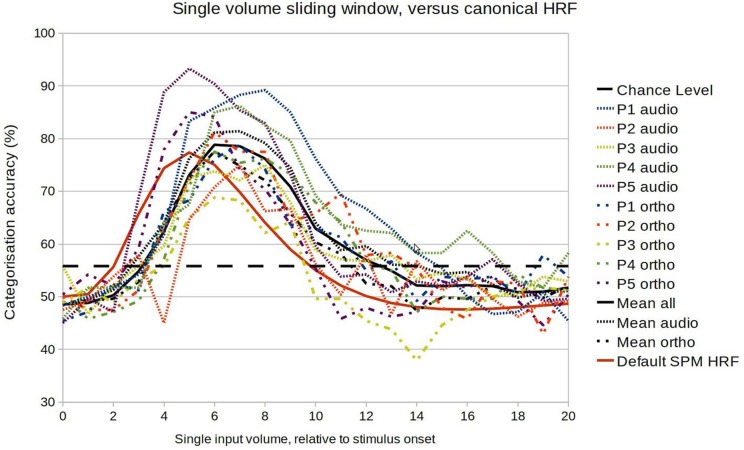
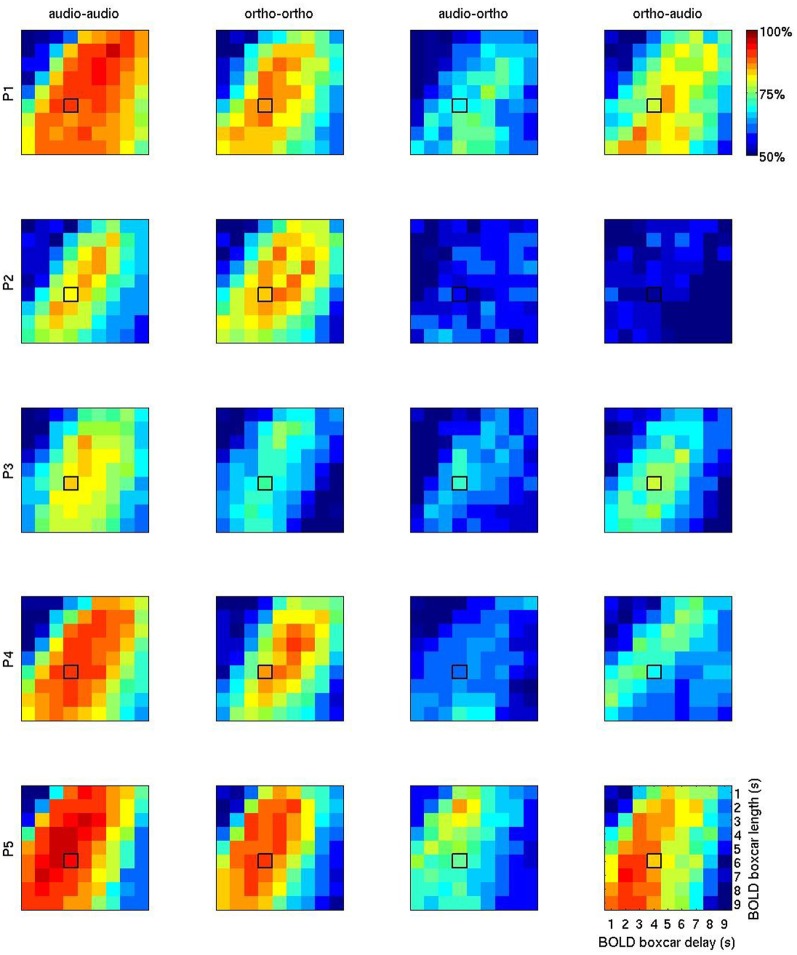
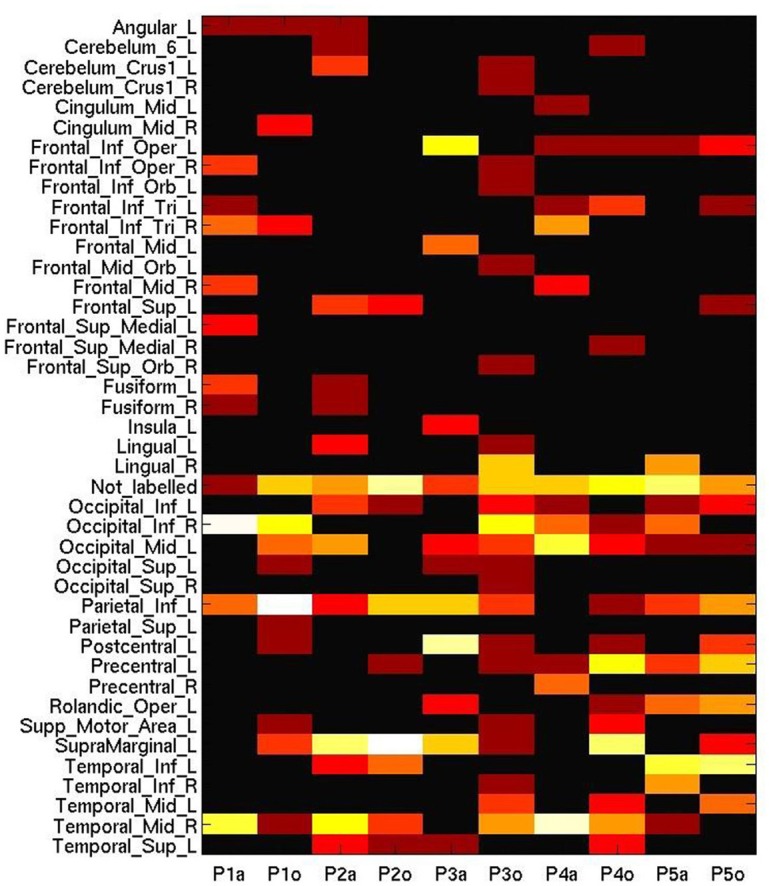
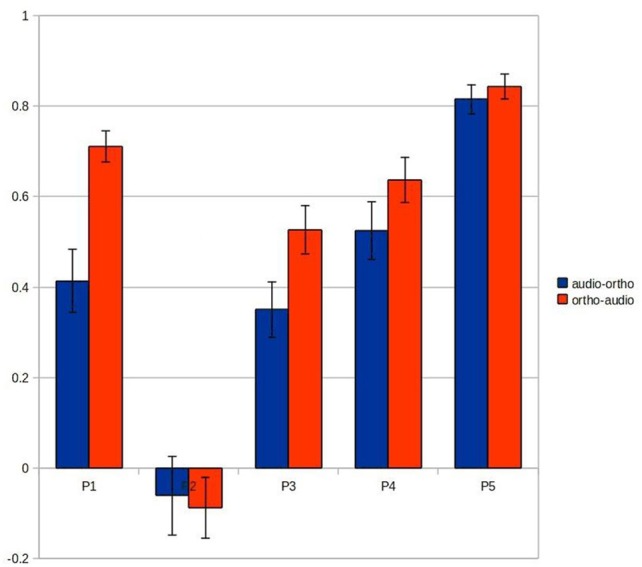
Both embodied and symbolic accounts of conceptual organization would predict partial sharing and partial differentiation between the neural activations seen for concepts activated via different stimulus modalities. But cross-participant and cross-session variability in BOLD activity patterns makes analyses of such patterns with MVPA methods challenging. Here, we examine the effect of cross-modal and individual variation on the machine learning analysis of fMRI data recorded during a word property generation task. We present the same set of living and non-living concepts (land-mammals, or work tools) to a cohort of Japanese participants in two sessions: the first using auditory presentation of spoken words; the second using visual presentation of words written in Japanese characters. Classification accuracies confirmed that these semantic categories could be detected in single trials, with within-session predictive accuracies of 80-90%. However cross-session prediction (learning from auditory-task data to classify data from the written-word-task, or vice versa) suffered from a performance penalty, achieving 65-75% (still individually significant at p « 0.05). We carried out several follow-on analyses to investigate the reason for this shortfall, concluding that distributional differences in neither time nor space alone could account for it. Rather, combined spatio-temporal patterns of activity need to be identified for successful cross-session learning, and this suggests that feature selection strategies could be modified to take advantage of this.
Keywords: GLM; MVPA; computational neurolinguistics; embodiment; fMRI; individual variability; machine learning.
Figures
Similar articles
-
Left perirhinal cortex codes for similarity in meaning between written words: Comparison with auditory word input.Neuropsychologia. 2015 Sep;76:4-16. doi: 10.1016/j.neuropsychologia.2015.03.016. Epub 2015 Mar 18. Neuropsychologia. 2015. PMID: 25795039
-
Decoding the meaning of unconsciously processed words using fMRI-based MVPA.Neuroimage. 2019 May 1;191:430-440. doi: 10.1016/j.neuroimage.2019.02.010. Epub 2019 Feb 21. Neuroimage. 2019. PMID: 30797072
-
Decoding multiple sound categories in the human temporal cortex using high resolution fMRI.PLoS One. 2015 Feb 18;10(2):e0117303. doi: 10.1371/journal.pone.0117303. eCollection 2015. PLoS One. 2015. PMID: 25692885 Free PMC article.
-
Multivoxel pattern analysis for FMRI data: a review.Comput Math Methods Med. 2012;2012:961257. doi: 10.1155/2012/961257. Epub 2012 Dec 6. Comput Math Methods Med. 2012. PMID: 23401720 Free PMC article. Review.
-
Reconciling embodied and distributional accounts of meaning in language.Top Cogn Sci. 2014 Jul;6(3):359-70. doi: 10.1111/tops.12096. Epub 2014 Jun 17. Top Cogn Sci. 2014. PMID: 24935903 Review.
Cited by
-
MEG Evidence That Modality-Independent Conceptual Representations Contain Semantic and Visual Features.J Neurosci. 2024 Jul 3;44(27):e0326242024. doi: 10.1523/JNEUROSCI.0326-24.2024. J Neurosci. 2024. PMID: 38806251 Free PMC article.
-
Is the Sensorimotor Cortex Relevant for Speech Perception and Understanding? An Integrative Review.Front Hum Neurosci. 2016 Sep 21;10:435. doi: 10.3389/fnhum.2016.00435. eCollection 2016. Front Hum Neurosci. 2016. PMID: 27708566 Free PMC article. Review.
-
Convergent and invariant object representations for sight, sound, and touch.Hum Brain Mapp. 2015 Sep;36(9):3629-40. doi: 10.1002/hbm.22867. Epub 2015 Jun 5. Hum Brain Mapp. 2015. PMID: 26047030 Free PMC article.
-
Temporal embedding and spatiotemporal feature selection boost multi-voxel pattern analysis decoding accuracy.J Neurosci Methods. 2020 Nov 1;345:108836. doi: 10.1016/j.jneumeth.2020.108836. Epub 2020 Jul 26. J Neurosci Methods. 2020. PMID: 32726664 Free PMC article.
-
Searchlight Classification Informative Region Mixture Model (SCIM): Identification of Cortical Regions Showing Discriminable BOLD Patterns in Event-Related Auditory fMRI Data.Front Neurosci. 2021 Feb 1;14:616906. doi: 10.3389/fnins.2020.616906. eCollection 2020. Front Neurosci. 2021. PMID: 33597841 Free PMC article.
References
-
- Barsalou L. W. (1999). Perceptual symbol systems. Behav. Brain Sci. 22, 577–660 - PubMed
-
- Barsalou L. W. (2003). Situated simulation in the human conceptual system. Lang. Cogn. Process. 18, 513–562
-
- Barsalou L. W., Solomon K. O., Wu L.-L. (1999). Perceptual simulation in conceptual tasks. Cultural, typological, and psychological perspectives in cognitive linguistics, in The Proceedings of the 4th Conference of the International Cognitive Linguistics Association, Vol. 3, (Albuquerque, NM: ), 209–228
LinkOut - more resources
Full Text Sources