

Acutely decreased thermoregulatory energy expenditure or decreased activity energy expenditure both acutely reduce food intake in mice
- PMID: 22936977
- PMCID: PMC3425585
- DOI: 10.1371/journal.pone.0041473
Acutely decreased thermoregulatory energy expenditure or decreased activity energy expenditure both acutely reduce food intake in mice
Abstract
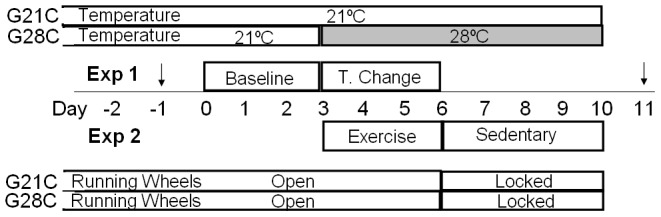
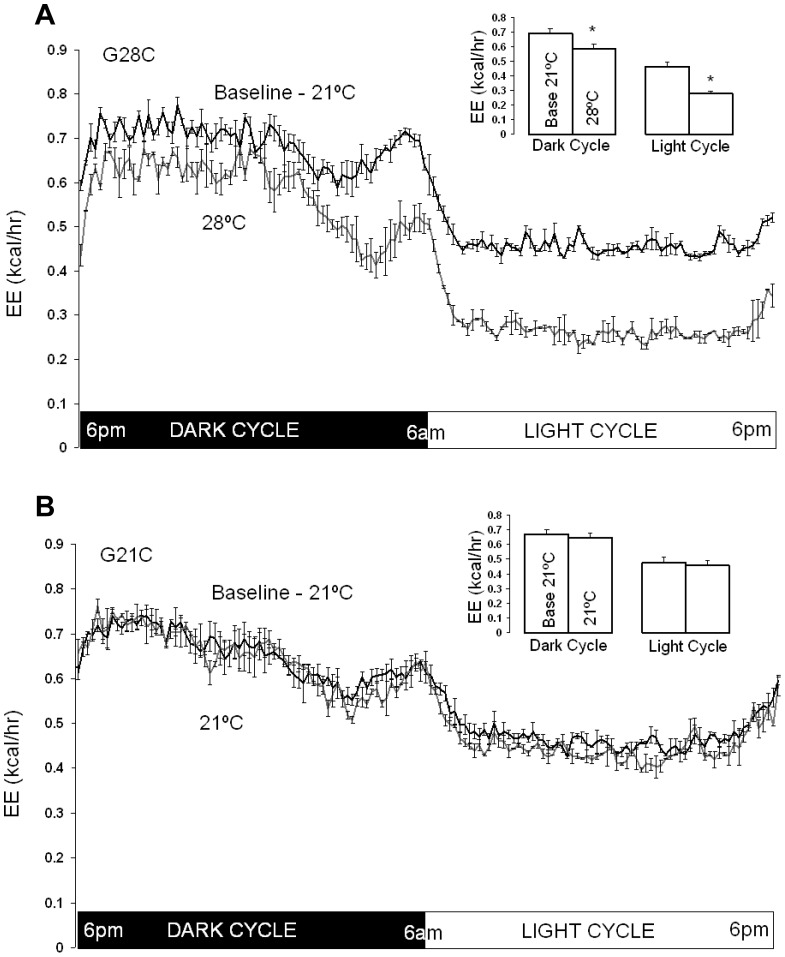
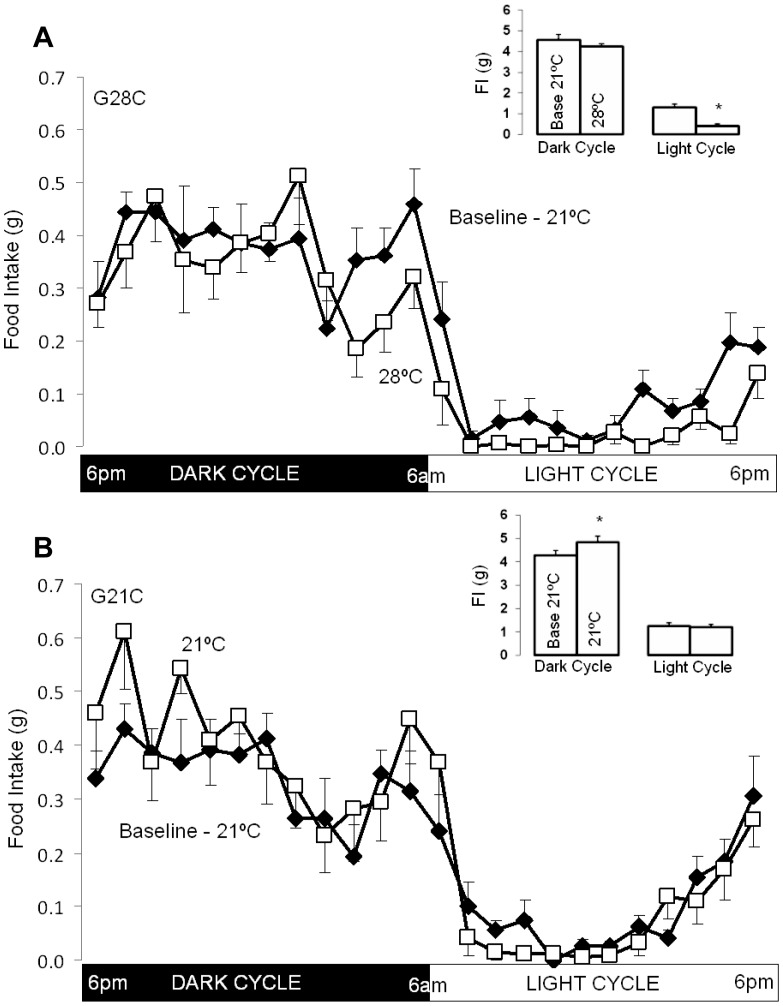
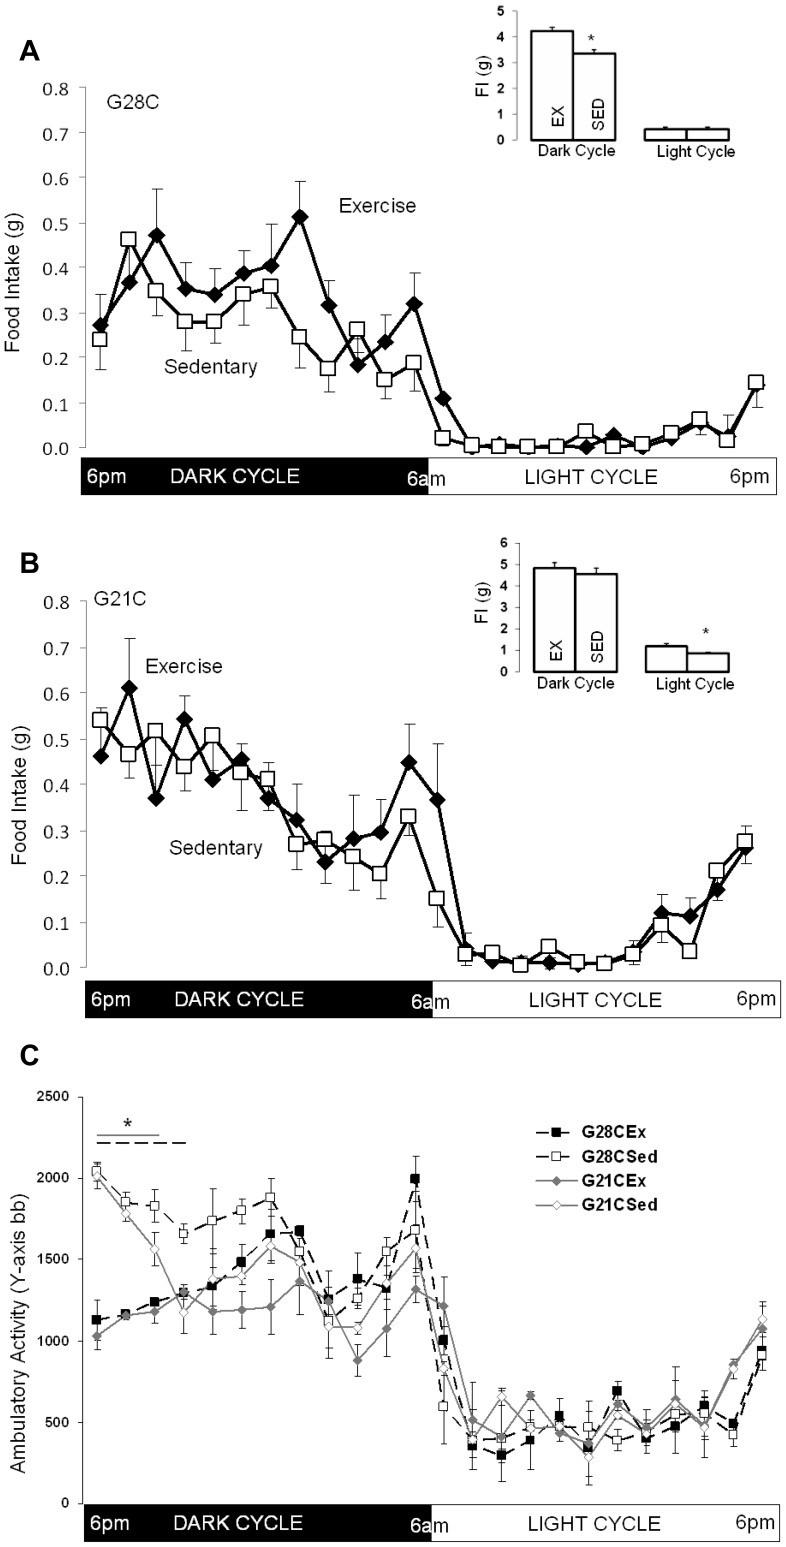
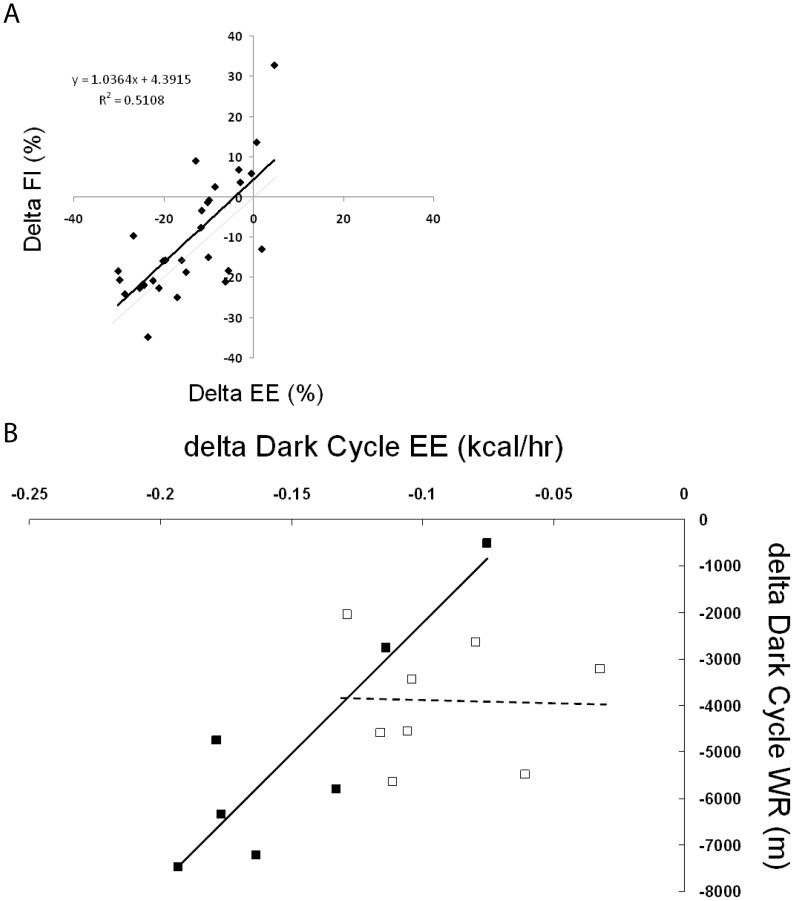
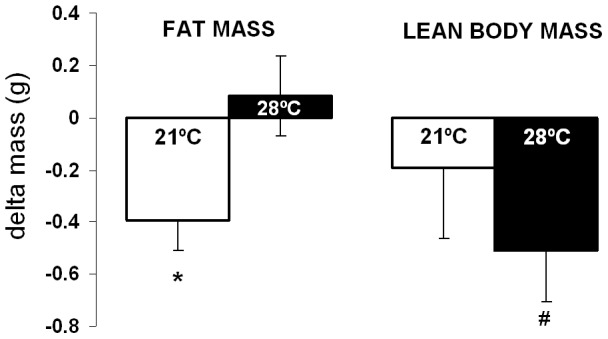
Despite the suggestion that reduced energy expenditure may be a key contributor to the obesity pandemic, few studies have tested whether acutely reduced energy expenditure is associated with a compensatory reduction in food intake. The homeostatic mechanisms that control food intake and energy expenditure remain controversial and are thought to act over days to weeks. We evaluated food intake in mice using two models of acutely decreased energy expenditure: 1) increasing ambient temperature to thermoneutrality in mice acclimated to standard laboratory temperature or 2) exercise cessation in mice accustomed to wheel running. Increasing ambient temperature (from 21 °C to 28 °C) rapidly decreased energy expenditure, demonstrating that thermoregulatory energy expenditure contributes to both light cycle (40 ± 1%) and dark cycle energy expenditure (15 ± 3%) at normal ambient temperature (21 °C). Reducing thermoregulatory energy expenditure acutely decreased food intake primarily during the light cycle (65 ± 7%), thus conflicting with the delayed compensation model, but did not alter spontaneous activity. Acute exercise cessation decreased energy expenditure only during the dark cycle (14 ± 2% at 21 °C; 21 ± 4% at 28 °C), while food intake was reduced during the dark cycle (0.9 ± 0.1 g) in mice housed at 28 °C, but during the light cycle (0.3 ± 0.1 g) in mice housed at 21 °C. Cumulatively, there was a strong correlation between the change in daily energy expenditure and the change in daily food intake (R(2) = 0.51, p<0.01). We conclude that acutely decreased energy expenditure decreases food intake suggesting that energy intake is regulated by metabolic signals that respond rapidly and accurately to reduced energy expenditure.
Conflict of interest statement
Figures

Similar articles
-
Leptin signaling is required for adaptive changes in food intake, but not energy expenditure, in response to different thermal conditions.PLoS One. 2015 Mar 10;10(3):e0119391. doi: 10.1371/journal.pone.0119391. eCollection 2015. PLoS One. 2015. PMID: 25756181 Free PMC article.
-
Effects of ambient temperature on adaptive thermogenesis during maintenance of reduced body weight in mice.Am J Physiol Regul Integr Comp Physiol. 2012 Aug 15;303(4):R438-48. doi: 10.1152/ajpregu.00092.2012. Epub 2012 Jul 3. Am J Physiol Regul Integr Comp Physiol. 2012. PMID: 22761182 Free PMC article.
-
The effect of wheel running and the estrous cycle on energy expenditure in female rats.Physiol Behav. 1989 Aug;46(2):259-63. doi: 10.1016/0031-9384(89)90265-5. Physiol Behav. 1989. PMID: 2602468
-
Indirect calorimetry in laboratory mice and rats: principles, practical considerations, interpretation and perspectives.Am J Physiol Regul Integr Comp Physiol. 2012 Sep 1;303(5):R459-76. doi: 10.1152/ajpregu.00137.2012. Epub 2012 Jun 20. Am J Physiol Regul Integr Comp Physiol. 2012. PMID: 22718809 Review.
-
Exercise and food intake. What is the relationship?Sports Med. 1988 Sep;6(3):135-45. doi: 10.2165/00007256-198806030-00002. Sports Med. 1988. PMID: 3055144 Review.
Cited by
-
Sex differences in microglial CX3CR1 signalling determine obesity susceptibility in mice.Nat Commun. 2017 Feb 22;8:14556. doi: 10.1038/ncomms14556. Nat Commun. 2017. PMID: 28223698 Free PMC article.
-
High total water loss driven by low-fat diet in desert-adapted mice.J Mammal. 2024 Sep 5;106(2):293-303. doi: 10.1093/jmammal/gyae093. eCollection 2025 Apr. J Mammal. 2024. PMID: 40206330 Free PMC article.
-
Leptin signaling is required for adaptive changes in food intake, but not energy expenditure, in response to different thermal conditions.PLoS One. 2015 Mar 10;10(3):e0119391. doi: 10.1371/journal.pone.0119391. eCollection 2015. PLoS One. 2015. PMID: 25756181 Free PMC article.
-
Increased Cost of Motor Activity and Heat Transfer between Non-Shivering Thermogenesis, Motor Activity, and Thermic Effect of Feeding in Mice Housed at Room Temperature - Implications in Pre-Clinical Studies.Front Nutr. 2016 Oct 6;3:43. doi: 10.3389/fnut.2016.00043. eCollection 2016. Front Nutr. 2016. PMID: 27766254 Free PMC article.
-
Supplementation with artificial sweetener and capsaicin alters metabolic flexibility and performance in heat-stressed and feed-restricted pigs.J Anim Sci. 2022 Aug 1;100(8):skac195. doi: 10.1093/jas/skac195. J Anim Sci. 2022. PMID: 35908791 Free PMC article.
References
-
- Kennedy GC (1953) The role of depot fat in the hypothalamic control of food intake in the rat. Proc R Soc Lond B Biol Sci 140: 578–96. - PubMed
-
- Cabanac M (2001) Regulation and the ponderostat. Int J Obes Relat Metab Disord 25 Suppl 5: S7–12. - PubMed
-
- Leibel RL, Rosenbaum M, Hirsch J (1995) Changes in energy expenditure resulting from altered body weight. N Engl J Med 332: 621–8. - PubMed
Publication types
MeSH terms
Grants and funding
LinkOut - more resources
Full Text Sources
Other Literature Sources
