

Size matters: concurrency and the epidemic potential of HIV in small networks
- PMID: 22937011
- PMCID: PMC3427300
- DOI: 10.1371/journal.pone.0043048
Size matters: concurrency and the epidemic potential of HIV in small networks
Abstract
Background: Generalized heterosexual epidemics are responsible for the largest share of the global burden of HIV. These occur in populations that do not have high rates of partner acquisition, and research suggests that a pattern of fewer, but concurrent, partnerships may be the mechanism that provides the connectivity necessary for sustained transmission. We examine how network size affects the impact of concurrency on network connectivity.
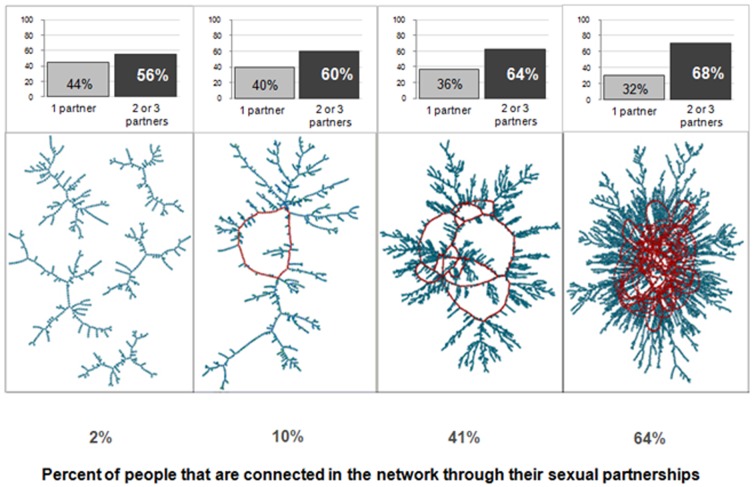
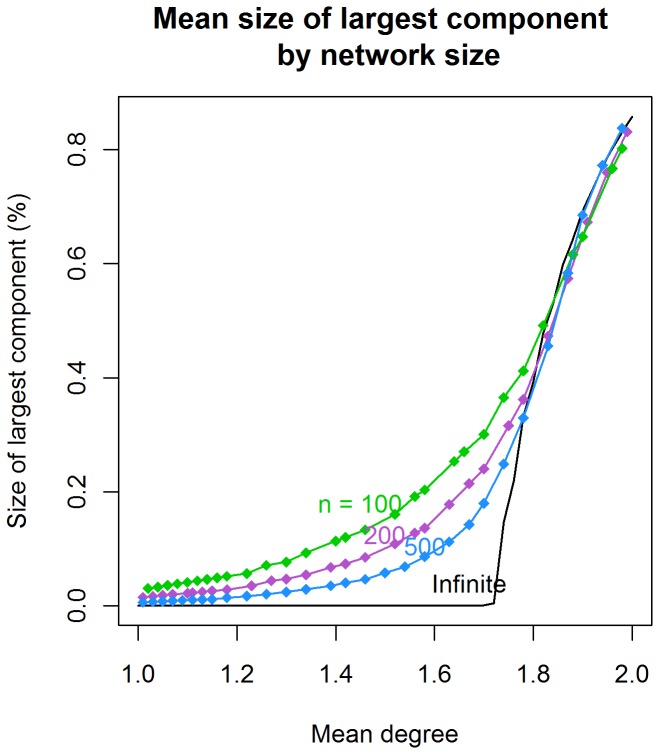
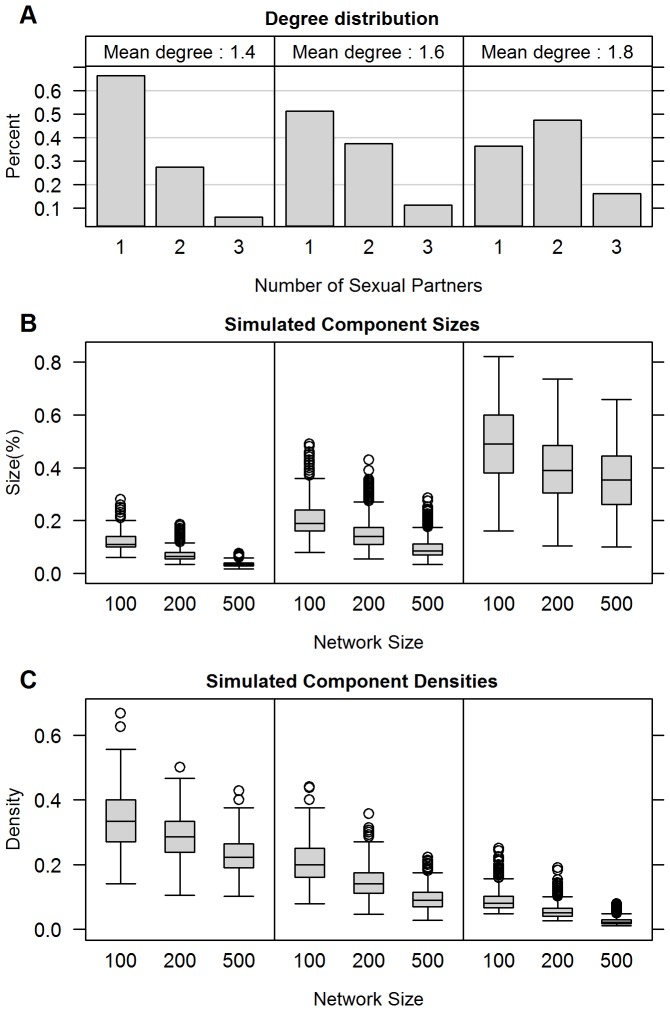
Methodology/principal findings: We use a stochastic network model to generate a sample of networks, varying the size of the network and the level of concurrency, and compare the largest components for each scenario to the asymptotic expected values. While the threshold for the growth of a giant component does not change, the transition is more gradual in the smaller networks. As a result, low levels of concurrency generate more connectivity in small networks.
Conclusions/significance: Generalized HIV epidemics are by definition those that spread to a larger fraction of the population, but the mechanism may rely in part on the dynamics of transmission in a set of linked small networks. Examples include rural populations in sub-Saharan Africa and segregated minority populations in the US, where the effective size of the sexual network may well be in the hundreds, rather than thousands. Connectivity emerges at lower levels of concurrency in smaller networks, but these networks can still be disconnected with small changes in behavior. Concurrency remains a strategic target for HIV combination prevention programs in this context.
Conflict of interest statement
Figures
References
-
- Centers for Disease Control (2008) HIV Prevalence Estimates – United States, 2006. MMWR 57: 1073–1076. - PubMed
-
- Kenya National Bureau of Statistics, ICF Macro (2010) 2008–09 Kenya Demographic and Health Survey. Calverton, MarylandUSA: KNBS and ICF Macro.
-
- Kenyon C, Dlamini S, Boulle A, White RG, Badri M (2009) A network-level explanation for the differences in HIV prevalence in South Africa's racial groups. Ajar-African Journal of Aids Research 8: 243–254. - PubMed
-
- National Bureau of Statistics (NBS) [Tanzania], Macro International Inc. (2009) Tanzania HIV/AIDS and Malaria Indicator Survey: Key Findings. Calverton, MarylandUSA: NBS and Macro International Inc.
Publication types
MeSH terms
Grants and funding
LinkOut - more resources
Full Text Sources
Medical
Research Materials
