. 2012;7(8):e43067.
doi: 10.1371/journal.pone.0043067. Epub 2012 Aug 22.

Ethanol-induced face-brain dysmorphology patterns are correlative and exposure-stage dependent

Affiliations

Ethanol-induced face-brain dysmorphology patterns are correlative and exposure-stage dependent

Robert J Lipinski et al. PLoS One. 2012.

Abstract

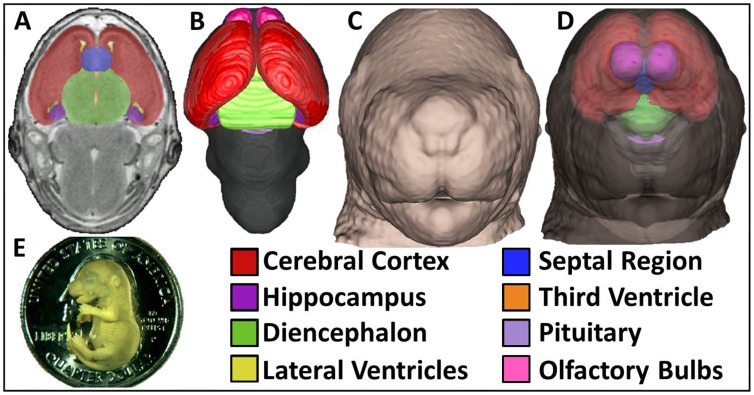
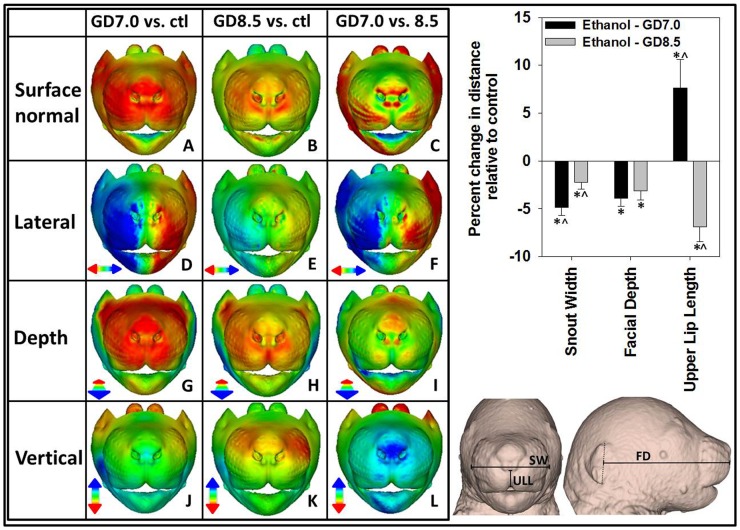
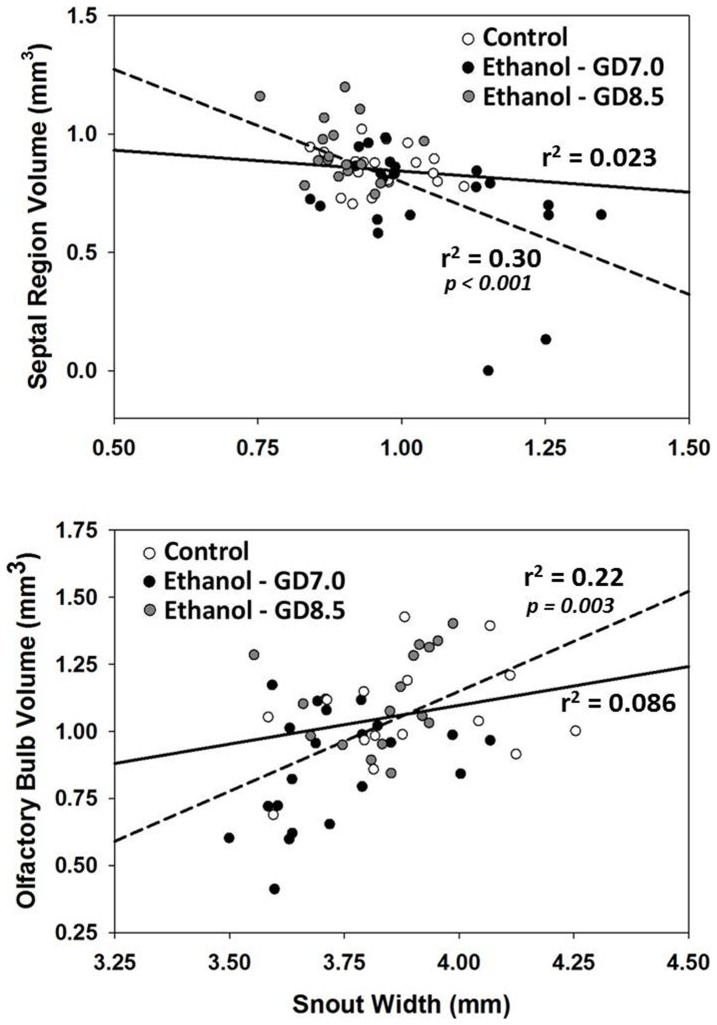
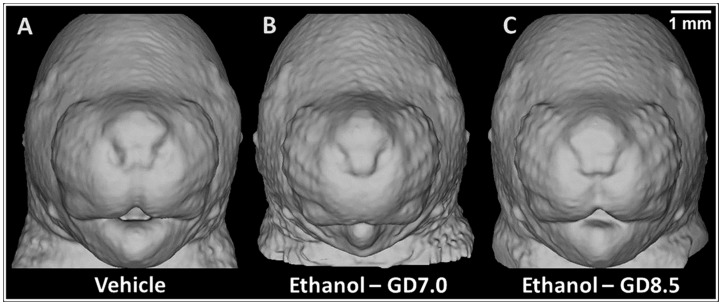
Prenatal ethanol exposure is the leading preventable cause of congenital mental disability. Whereas a diagnosis of fetal alcohol syndrome (FAS) requires identification of a specific pattern of craniofacial dysmorphology, most individuals with behavioral and neurological sequelae of heavy prenatal ethanol exposure do not exhibit these defining facial characteristics. Here, a novel integration of MRI and dense surface modeling-based shape analysis was applied to characterize concurrent face-brain phenotypes in C57Bl/6J fetuses exposed to ethanol on gestational day (GD)7 or GD8.5. The facial phenotype resulting from ethanol exposure depended upon stage of insult and was predictive of unique patterns of corresponding brain abnormalities. Ethanol exposure on GD7 produced a constellation of dysmorphic facial features characteristic of human FAS, including severe midfacial hypoplasia, shortening of the palpebral fissures, an elongated upper lip, and deficient philtrum. In contrast, ethanol exposure on GD8.5 caused mild midfacial hypoplasia and palpebral fissure shortening, a shortened upper lip, and a preserved philtrum. These distinct, stage-specific facial phenotypes were associated with unique volumetric and shape abnormalities of the septal region, pituitary, and olfactory bulbs. By demonstrating that early prenatal ethanol exposure can cause more than one temporally-specific pattern of defects, these findings illustrate the need for an expansion of current diagnostic criteria to better capture the full range of facial and brain dysmorphology in fetal alcohol spectrum disorders.


Conflict of interest statement

Competing Interests: The authors have declared that no competing interests exist.

Figures

Figure 1
Figure 1. MRM enables concurrent 3D analyses of the brain and face of GD17 mouse fetuses.
Forebrain and pituitary regions were manually segmented from transverse 39 µm MRM sections (A). 3D brain reconstructions were generated by overlaying manually segmented regions with whole-brain masks (B). From the same MRM scans, 3D head reconstructions were created featuring detailed facial surfaces (C). The brain and face can be visualized concurrently in situ by reducing head surface opacity (D). The size of a GD17 mouse fetus can be appreciated when shown in scale with a U.S. quarter dollar coin (E).
Figure 2
Figure 2. DSM illustrates unique facial phenotypes resulting from stage-specific ethanol exposure.
(Left) Mean surface shape of the GD7 and GD8.5 exposure groups relative to the control group is shown in the first and second columns respectively, while the GD7 group is directly compared to the GD8.5 ethanol-exposed group in the third column. (A–C) Color-map comparisons reflecting the displacement of mean surface shape for the indicated groups, where red indicates regions most distant and internal, while blue indicates regions most distant and external. Other colors shown in the scales identify intermediate positions. (D–L) Color-map comparisons reflecting the displacement of the indicated mean surface shapes parallel to the three orthogonal axes. Red and blue color intensities reflect displacement in the direction indicated by the corresponding color-coded arrow. Changes are shown at a scale of 1.2 standard deviations. (Right) Snout width (SW) was measured between the most lateral 3rd row of vibrissae; Median upper lip length (ULL) was measured from the lower edge of the nostrils to the bottom of the upper lip; Facial depth (FD) was measured from the middle of the ear to the top of the philtrum. Values represent the means + the S.E.M. *p<0.05 compared to control group.p<0.05 compared to counterpart ethanol exposure group.
Figure 3
Figure 3. Volumetric brain measurements demonstrate unique brain abnormalities resulting from stage-specific ethanol exposure.
(Right) Total brain volumes were derived from automated skull stripping. Values represent the mean + S.E.M. Letters above each bar indicate group classes; the same letter above a subset of bars denotes lack of statistical difference, whereas different letters represent statistically different classes (p<0.05). (Right) For determination of disproportionate differences, the volume of each manually segmented forebrain region was calculated as a percentage of total brain volume for each animal. Remaining volume includes mid- and hindbrain regions. To illustrate relative changes on the same scale, percent volumes are normalized to mean control values. Values represent the mean ± the S.E.M. *p<0.05 compared to control group. p<0.05 compared to counterpart ethanol exposure group.
Figure 4
Figure 4. DSM illustrates unique brain and face phenotypes resulting from stage-specific ethanol exposure.
Mean shape comparisons are shown for the facial surface along with the olfactory bulbs (o), septal region (s), and pituitary (p). Comparisons parallel those shown in Fig. 2. Changes are shown at a scale of 1.5 standard deviations. In this anterior-oblique view, differences in palpebral fissure length are readily apparent.
Figure 5
Figure 5. Scanning electron microscopy illustrates unique brain malformations in GD12 embryos exposed to ethanol at GD7 or GD8.5.
(A–F) Images of specimens hemisected in the coronal (frontal) plane illustrate posterior and anterior aspects of the embryonic brain in control and ethanol-affected groups. (G–I) Additional GD12 embryos were cut to provide a sagittal view of the brain. Notable abnormalities include differences in width of the third ventricle (dashed calipers), and the area from which the septal region will develop (dashed outline in the anterior view and solid calipers in sagittal view). Ganglionic eminences (*).
Figure 6
Figure 6. Stage-specific ethanol exposure causes correlative face and brain abnormalities.
Regression lines were plotted for the control group (solid line) and for the ethanol exposure groups (dashed line). In the exposed groups, a significant negative correlation between philtrum length and septal region volume, along with a significant positive correlation between snout width and olfactory bulb volume, was found. Correlations in the control group were not significant (p = 0.55, p = 0.30, respectively).
Figure 7
Figure 7. Unique facial dysmorphology induced by stage-specific ethanol exposure in the mouse corresponds to distinct clinical phenotypes.
Along with a control animal (A), representative examples of fetuses severely affected by ethanol exposure on GD7 (B) and GD8.5 (C) are shown. The elongated upper lip with deficient philtrum of the GD7 exposed mouse mimics that seen in children with full-blown FAS . The “fish-shaped” upper lip and bulbous nasal tip of the mouse exposed at GD8.5 resembles that of children with DiGeorge syndrome . For the animals shown, the face and brain can be visualized concurrently in 3D in Movie S1.

References

    1. Abel EL, Sokol RJ (1986) Fetal alcohol syndrome is now leading cause of mental retardation. Lancet 2: 1222. - PubMed
    1. May PA, Gossage JP, Kalberg WO, Robinson LK, Buckley D, et al. (2009) Prevalence and epidemiologic characteristics of FASD from various research methods with an emphasis on recent in-school studies. Developmental disabilities research reviews 15: 176–192. - PubMed
    1. Marcucio RS, Cordero DR, Hu D, Helms JA (2005) Molecular interactions coordinating the development of the forebrain and face. Dev Biol 284: 48–61. - PubMed
    1. Hu D, Marcucio RS (2009) A SHH-responsive signaling center in the forebrain regulates craniofacial morphogenesis via the facial ectoderm. Development 136: 107–116. - PMC - PubMed
    1. Parsons TE, Schmidt EJ, Boughner JC, Jamniczky HA, Marcucio RS, et al. (2011) Epigenetic integration of the developing brain and face. Developmental dynamics : an official publication of the American Association of Anatomists 240: 2233–2244. - PMC - PubMed

Publication types