. 2012:2:615.
doi: 10.1038/srep00615. Epub 2012 Aug 30.

Evidence for a bacterial mechanism for group-specific social odors among hyenas

Affiliations

Evidence for a bacterial mechanism for group-specific social odors among hyenas

Kevin R Theis et al. Sci Rep. 2012.

Abstract

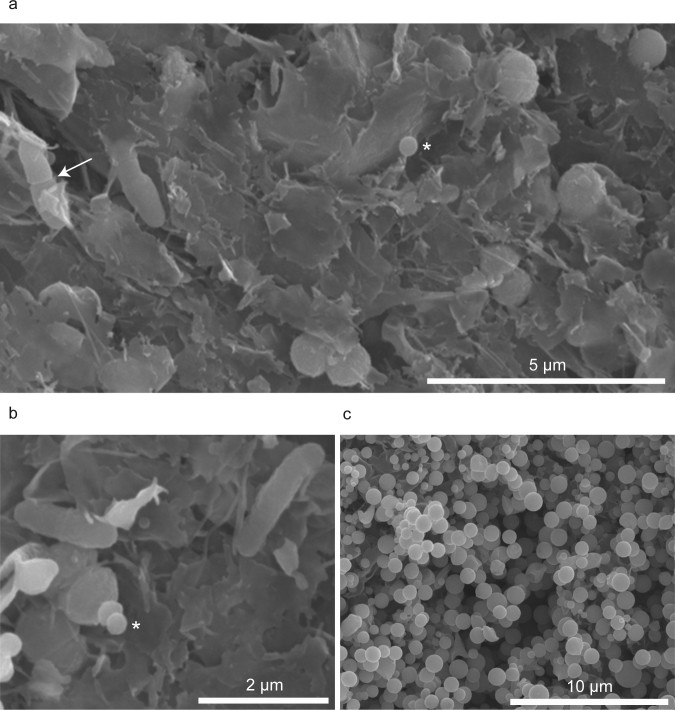
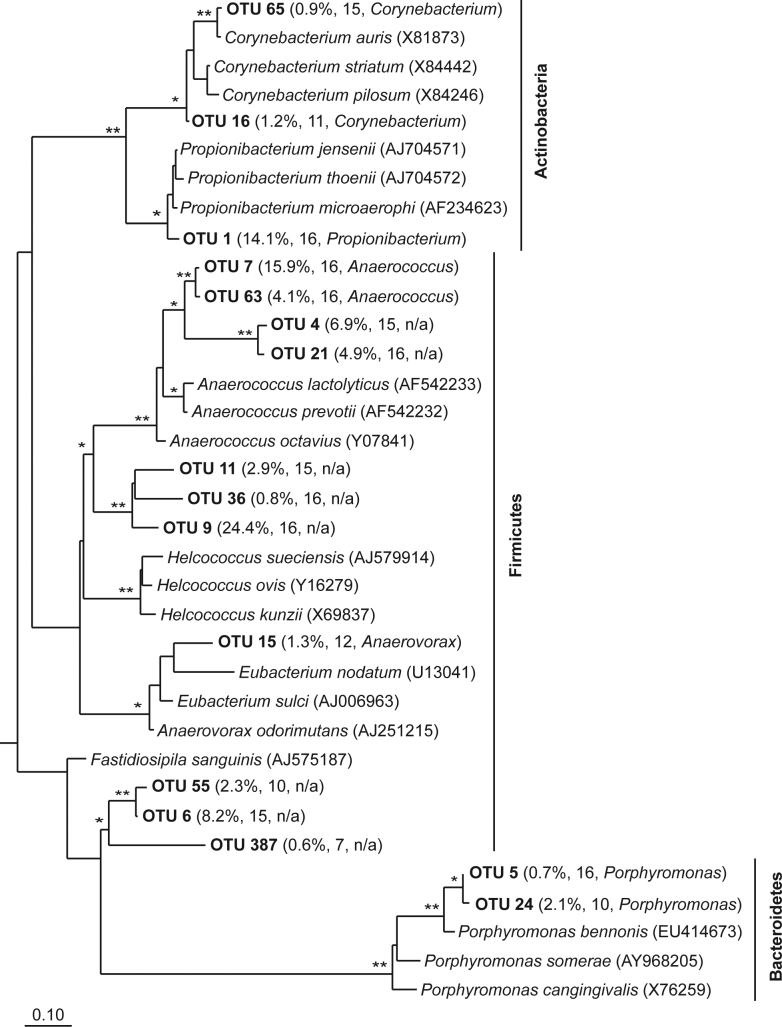
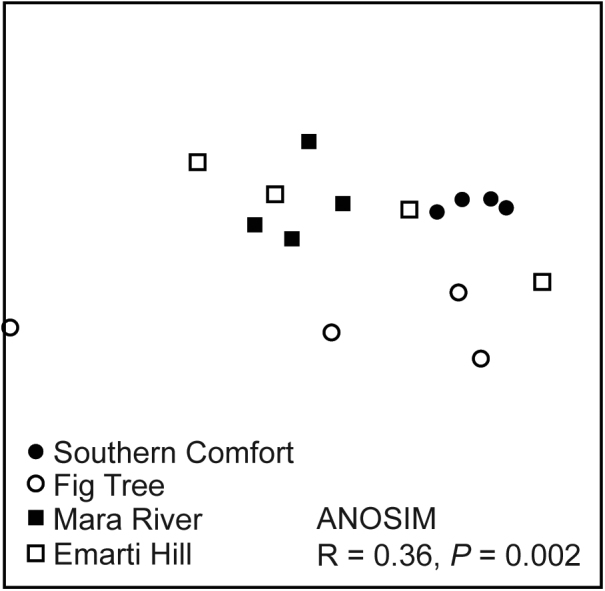
Symbiotic microbes can benefit their animal hosts by enhancing the diversity of communication signals available to them. The fermentation hypothesis for chemical recognition posits that 1) fermentative bacteria in specialized mammalian scent glands generate odorants that mammals co-opt to communicate with one another, and 2) that variation in scent gland odors is due to underlying variation in the structure of bacterial communities within scent glands. For example, group-specific social odors are suggested to be due to members of the same social group harboring more similar bacterial communities in their scent glands than do members of different social groups. We used 16S rRNA gene surveys to show that 1) the scent secretions of spotted hyenas are densely populated by fermentative bacteria whose closest relatives are well-documented odor producers, and that 2) these bacterial communities are more similar among hyenas from the same social group than among those from different groups.


Figures

Figure 1
Figure 1. Relative locations of the four sampled hyena clans within the Masai Mara National Reserve (MMNR), Kenya.
The dashed lines represent estimated territorial boundaries of clans—sampled or otherwise—in the north-central area of the Reserve during the study period. We deeply surveyed the bacterial communities in the scent pouches of four lactating females from each of the four sampled clans.
Figure 2
Figure 2. Scanning electron micrographs of spotted hyena scent pouch secretions (called ‘paste’).
Panels A and B reveal rod and coccus-shaped bacteria embedded in the paste substrate. The arrow indicates an apparent division ring on a rod-shaped bacterium, and asterisks indicate presumed lipid droplets. Panel C illustrates the abundant clumping of presumed lipid droplets at the edge of the sample post-processing. A, B and C were x5000, x12000 and x2500 magnifications, respectively.
Figure 3
Figure 3. Phylogenetic characterization of the prominent operational taxonomic units (OTUs) in the scent pouches of female hyenas.
The 16S rRNA-based phylogenetic tree illustrates the evolutionary relationships among OTUs constituting, on average, ≥ 0.5% of the surveyed sequences and nearest-neighbor type strains. For each of the OTUs, the respective information in parentheses indicates the average percent abundance of the OTU among the 16 scent pouches, the total number of pouches in which the OTU was found, and, if applicable, the genus to which the OTU was assigned by the RDP Classifier tool using an 80% confidence threshold. An accession number is provided for each type strain. The tree—rooted with Deinococcus radiodurans (Y11332)—was generated using the Randomized Accelerated Maximum Likelihood (RAxML) rapid bootstrap algorithm across 1000 iterations. Single and double asterisks denote bootstrap values ≥ 90 and 95, respectively. The scale bar, or branch length, reflects the mean number of nucleotide substitutions per site.
Figure 4
Figure 4. Nonmetric multidimensional scaling (NMS) plot illustrating variation in scent pouch bacterial community structure among hyena clans.
In NMS plots, the distance of sampled communities to one another reflects their underlying distance in multivariate space—here based on the Bray-Curtis similarity index. The X and Y axes were symmetrical, and the plot's stress (0.12)—a measure of its goodness-of-fit—indicated that the plot was an informative representation of community-level data.

References

    1. Rosenberg E., Sharon G., Atad I. & Zilber-Rosenberg I. The evolution of animals and plants via symbiosis with microorganisms. Environ. Microbiol. Rep. 2, 500–506 (2010). - PubMed
    1. Bosch T. C. G. & McFall-Ngai M. J. Metaorganisms as the new frontier. Zoology 114, 185–190 (2011). - PMC - PubMed
    1. Savinov A. Autocenosis and democenosis as individual- and population-level ecological categories in terms of symbiogenesis and systems approach. Russian J. Ecol. 42, 179–185 (2011).
    1. Bäckhed F., Ley R. E., Sonnenburg J. L., Peterson D. A. & Gordon J. I. Host-bacterial mutualism in the human intestine. Science 307, 1915–1920 (2005). - PubMed
    1. Fraune S. & Bosch T. C. G. Why bacteria matter in animal development and evolution. Bioessays 32, 571–580 (2010). - PubMed

Publication types

Substances

LinkOut - more resources