

Creating a "pro-survival" phenotype through epigenetic modulation
- PMID: 22938904
- PMCID: PMC3782099
- DOI: 10.1016/j.surg.2012.06.036
Creating a "pro-survival" phenotype through epigenetic modulation
Abstract
Background: We demonstrated recently that treatment with suberoylanilide hydroxamic acid (SAHA), a histone deacetylase inhibitor, improved survival in a rodent model of lipopolysaccharide (LPS)-induced endotoxic shock. The precise mechanisms, however, have not been well-defined. The aim of this study was to investigate the impact of SAHA treatment on gene expression profiles at an early stage of shock.
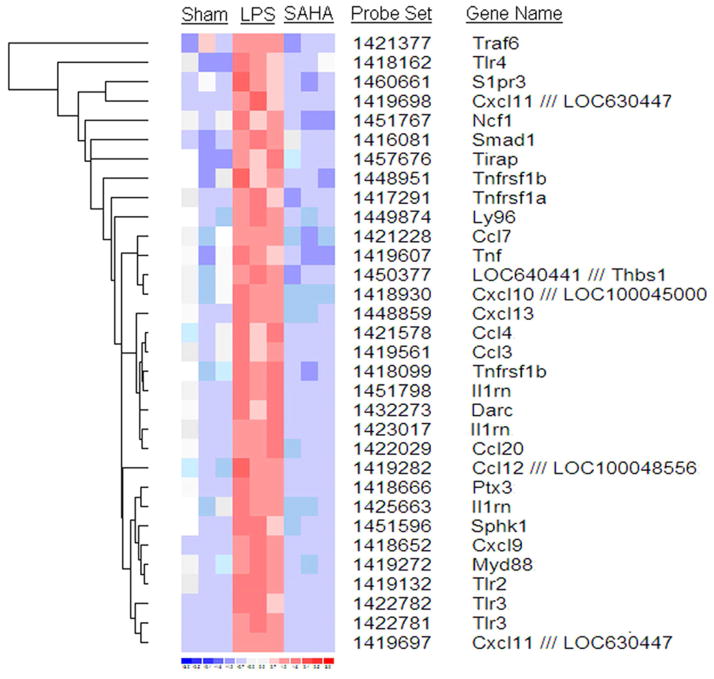
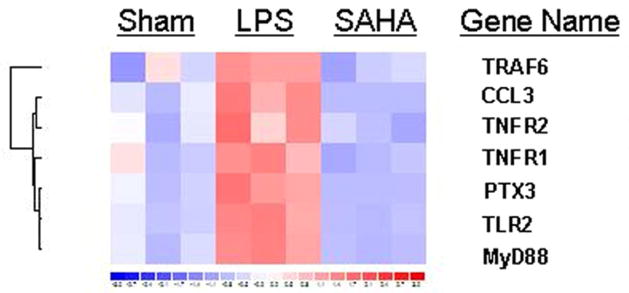
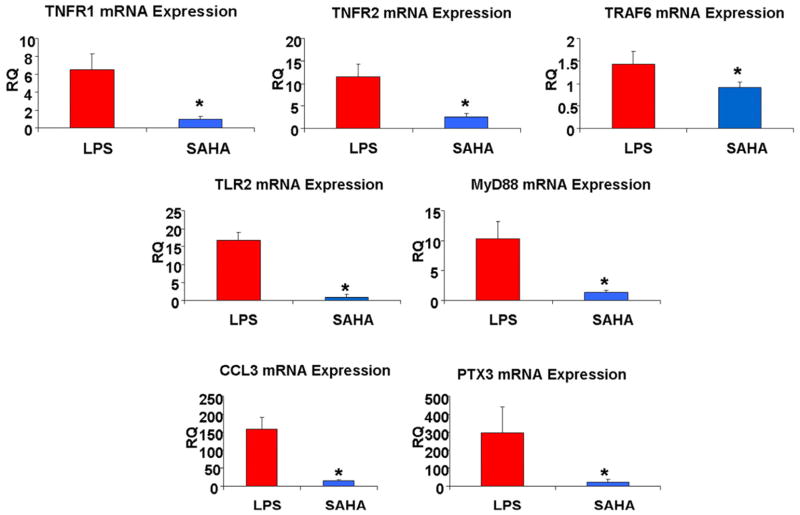
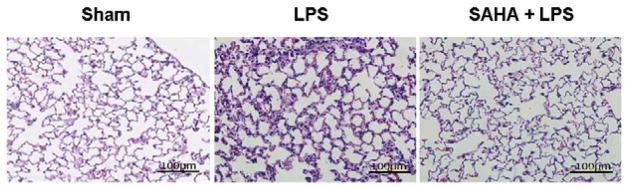
Methods: Male C57BL/6J mice were treated with or without SAHA (50 mg/kg, IP), followed by a lethal dose of LPS (20 mg/kg, IP) and a second dose of SAHA. Lungs of the animals (LPS and SAHA+LPS groups; n = 3 per group) were harvested 3 hours post-LPS insult. Sham mice (no LPS and no SAHA) served as controls. RNA was isolated from the tissues and gene expression was analyzed using Affymatrix microarray (23,000 genes). A lower confidence bound of fold change was determined for comparison of LPS versus SAHA + LPS, and genes with a lower confidence bound of >2 were considered to be differentially expressed. Reverse transcriptase polymerase chain reaction, Western blotting, and tissue staining were performed to verify the key changes. Network graphs were used to determine gene interaction and biologic relevance.
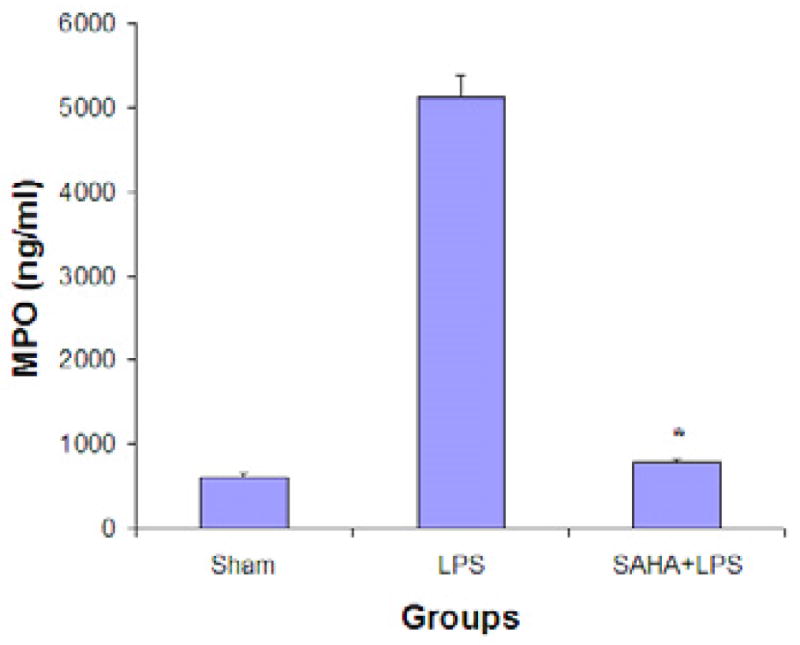
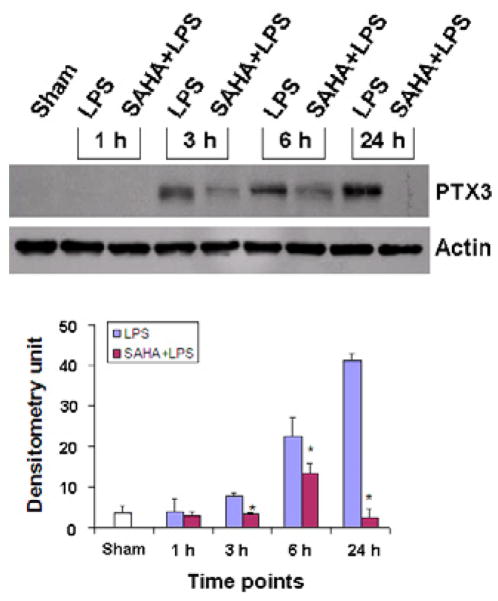
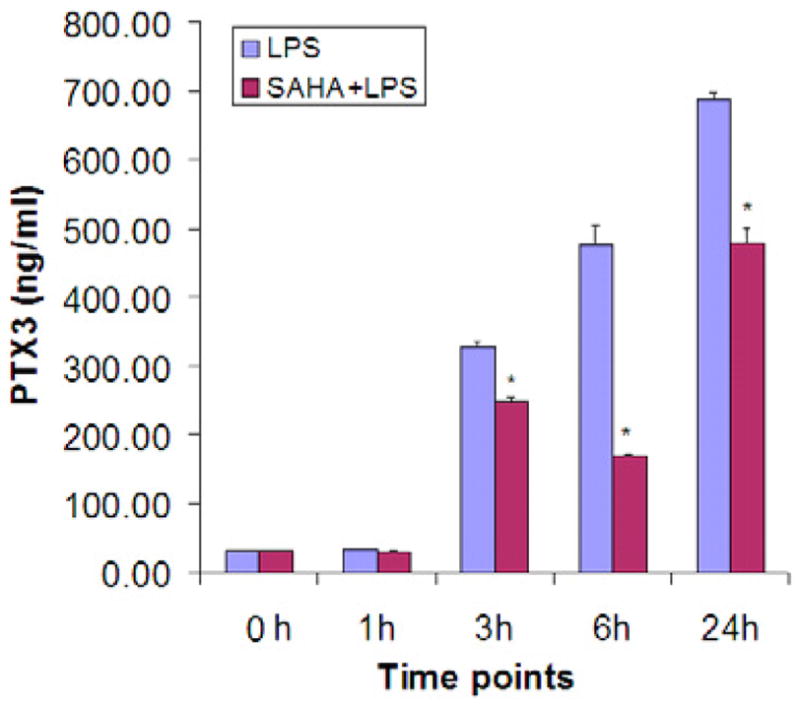
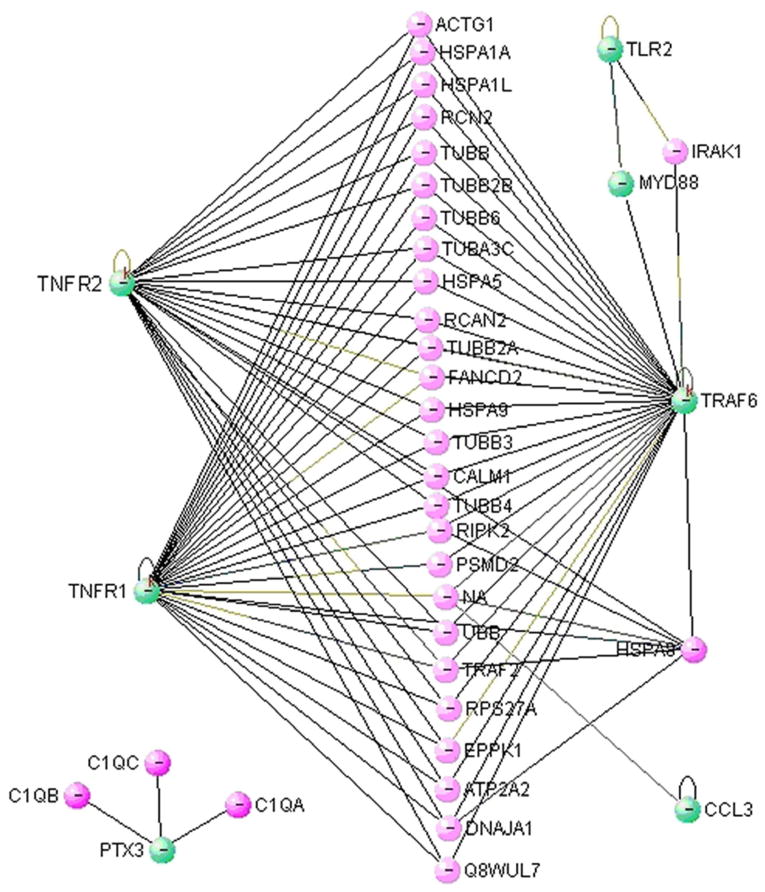
Results: The expression of many genes known to be involved in septic pathophysiology changed after the LPS insult. Interestingly, a number of genes not implicated previously in the septic response were also altered. SAHA treatment attenuated expression of several key genes involved in inflammation. It also decreased neutrophil infiltration in lungs and histologic evidence of acute lung injury. Further analysis confirmed genes engaged in the cellular and humoral arms of the innate immune system were specifically inhibited by SAHA. Gene network analysis identified numerous molecules for the potential development of targeted therapies.
Conclusion: Administration of SAHA in a rodent model of LPS shock rapidly modulates gene transcription, with an attenuation of inflammatory mediators derived from both arms (cellular and humoral) of the innate immune system. This may be a novel mechanism responsible for the survival advantage seen with SAHA treatment.
Copyright © 2012 Mosby, Inc. All rights reserved.
Figures
Similar articles
-
Surviving lethal septic shock without fluid resuscitation in a rodent model.Surgery. 2010 Aug;148(2):246-54. doi: 10.1016/j.surg.2010.05.003. Epub 2010 Jun 19. Surgery. 2010. PMID: 20561658 Free PMC article.
-
Protective effect of suberoylanilide hydroxamic acid against LPS-induced septic shock in rodents.Shock. 2009 Nov;32(5):517-23. doi: 10.1097/SHK.0b013e3181a44c79. Shock. 2009. PMID: 19295477
-
Identification of citrullinated histone H3 as a potential serum protein biomarker in a lethal model of lipopolysaccharide-induced shock.Surgery. 2011 Sep;150(3):442-51. doi: 10.1016/j.surg.2011.07.003. Surgery. 2011. PMID: 21878229 Free PMC article.
-
Treatment with histone deacetylase inhibitor attenuates MAP kinase mediated liver injury in a lethal model of septic shock.J Surg Res. 2010 Sep;163(1):146-54. doi: 10.1016/j.jss.2010.04.024. Epub 2010 May 10. J Surg Res. 2010. PMID: 20599223 Free PMC article.
-
Protective effect of suberoylanilide hydroxamic acid against lipopolysaccharide-induced liver damage in rodents.J Surg Res. 2015 Apr;194(2):544-550. doi: 10.1016/j.jss.2014.10.056. Epub 2014 Nov 6. J Surg Res. 2015. PMID: 25479907 Free PMC article.
Cited by
-
Novel pharmacologic treatment attenuates septic shock and improves long-term survival.Surgery. 2013 Aug;154(2):206-13. doi: 10.1016/j.surg.2013.04.003. Surgery. 2013. PMID: 23889949 Free PMC article.
-
Class I histone deacetylase inhibitor valproic acid reverses cognitive deficits in a mouse model of septic encephalopathy.Neurochem Res. 2013 Nov;38(11):2440-9. doi: 10.1007/s11064-013-1159-0. Epub 2013 Sep 26. Neurochem Res. 2013. PMID: 24072674
-
Epigenetic mechanisms of Immune remodeling in sepsis: targeting histone modification.Cell Death Dis. 2023 Feb 11;14(2):112. doi: 10.1038/s41419-023-05656-9. Cell Death Dis. 2023. PMID: 36774341 Free PMC article.
-
The nature of the GRE influences the screening for GR-activity enhancing modulators.PLoS One. 2017 Jul 7;12(7):e0181101. doi: 10.1371/journal.pone.0181101. eCollection 2017. PLoS One. 2017. PMID: 28686666 Free PMC article.
-
Modified Suberoylanilide Hydroxamic Acid Reduced Drug-Associated Immune Cell Death and Organ Damage under Lipopolysaccharide Inflammatory Challenge.ACS Pharmacol Transl Sci. 2022 Oct 10;5(11):1128-1141. doi: 10.1021/acsptsci.2c00119. eCollection 2022 Nov 11. ACS Pharmacol Transl Sci. 2022. PMID: 36407956 Free PMC article.
References
-
- Angus DC, Linde-Zwirble W, Lidicker JM, Clermont G, Carcillo J, Pinsky M. Epidemiology of severe sepsis in the United States: Analysis of incidence, outcome, and associated costs of care. Crit Care Med. 2001;29(7):1303–1310. - PubMed
-
- Alberti C, Brun-Buisson C, Goodman SV, Guidici D, Granton J, Moreno R, Smithies M, Thomas O, Artigas A, Le Gall JR. Influence of systemic inflammatory response syndrome and sepsis on outcome of critically ill infected patients. Am J Respir Crit Care Med. 2003;168:77–78. - PubMed
-
- Russell JA. Management of sepsis. N Engl J Med. 2006;355:1699–1713. - PubMed
-
- Cinel I, Dellinger RP. Advances in pathogenesis and management of sepsis. Curr Opin Infect Dis. 2007;20:345–352. - PubMed
-
- Ianaro A, Tersigni M, D’Acquisto F. New Insight in LPS Antagonist. Mini Rev Med Chem. 2009;9(3):306–317. - PubMed
Publication types
MeSH terms
Substances
Grants and funding
LinkOut - more resources
Full Text Sources
