. 2012 Nov 10;433(1):262-72.
doi: 10.1016/j.virol.2012.08.016. Epub 2012 Aug 29.

West Nile virus growth is independent of autophagy activation

Affiliations

West Nile virus growth is independent of autophagy activation

Erica Beatman et al. Virology. .

Abstract

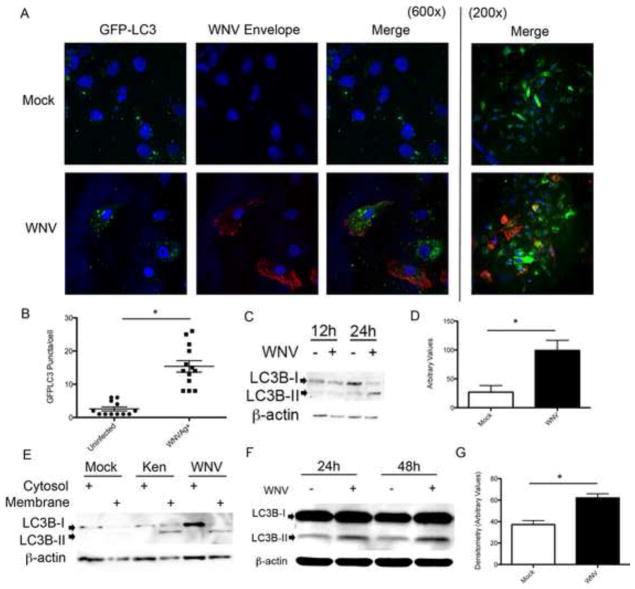
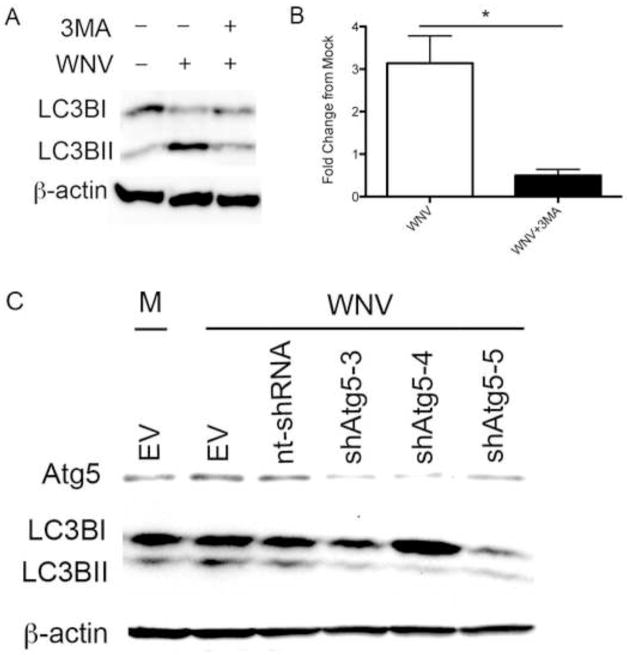
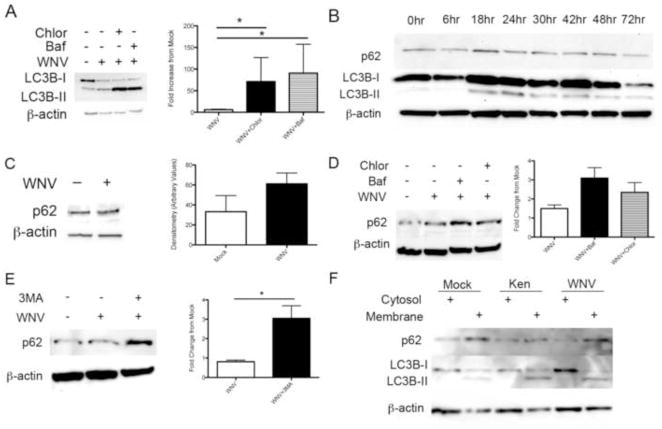
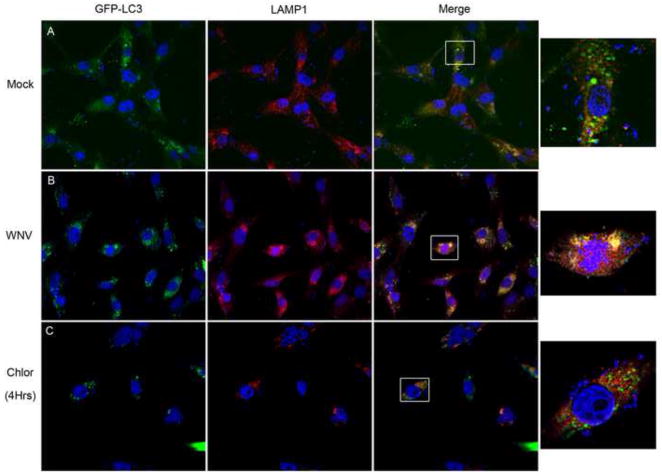
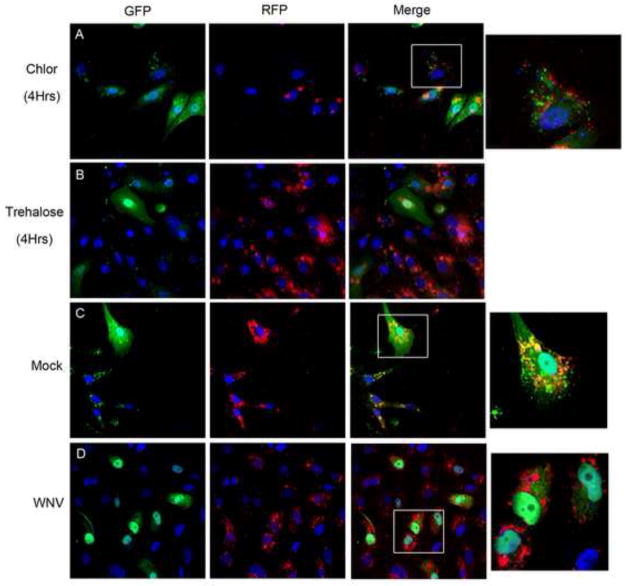
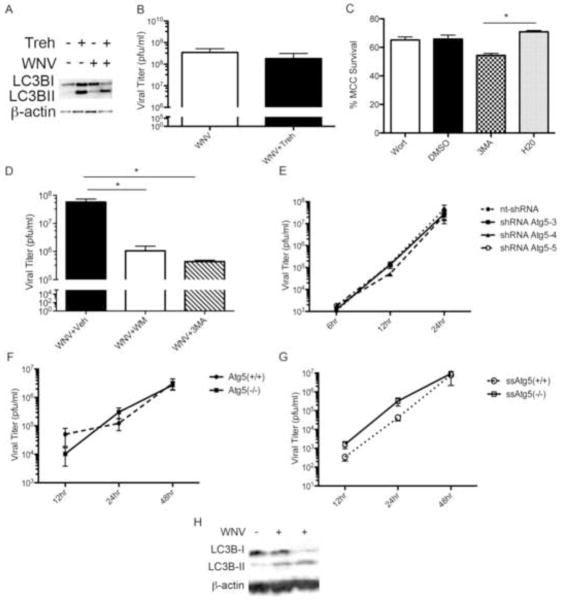
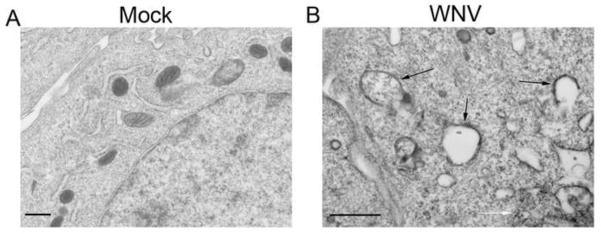
West Nile virus (WNV) is an arthropod-borne virus with a worldwide distribution that causes neurologic disease and death. Autophagy is a cellular homeostatic mechanism involved in antiviral responses but can be subverted to support viral growth as well. We show that autophagy is induced by WNV infection in cell culture and in primary neuron cultures. Following WNV infection, lysosomes co-localize with autophagosomes resulting in LC3B-II turnover and autolysosomal acidification. However, activation or inhibition of autophagy has no significant effect on WNV growth but pharmacologic inhibition of PI3 kinases associated with autophagy reduce WNV growth. Basal levels of p62/sequestosome1(SQSTM1) do not significantly change following WNV-induced autophagy activation, but p62 is turned over or degraded by autophagy activation implying that p62 expression is increased following WNV-infection. These data show that WNV-induces autophagy but viral growth is independent of autophagy activation suggesting that WNV-specific interactions with autophagy have diverged from other flaviviruses.


Figures

Figure 1
Figure 1
LC3B is lipidated following WNV Infection. Vero cells were transfected with GFP-LC3 expression plasmid followed by A) mock or WNV (MOI 3) inoculation, harvested at 24 hours post-infection, and labeled with antibody to WNV envelope antigen (cy3:red) and nuclei stained with DAPI. Images shown at 600x and 200x magnification. B) GFP-LC3 positive puncta were counted in WNV antigen negative (uninfected) and antigen positive cells (WNVAg+, *p<0.0001). C) Vero cells were mock or WNV (MOI 3) inoculated and cells were harvested at the specified time points post-infection and analyzed by western blot analysis for the LC3B-II. D) Relative LC3B-II band densities of 4 replicate experiments were measured with Image-J software and corrected for β-actin band density (*p=0.018). E) Vero cells were mock inoculated or inoculated with clone derived WNV or a Kenyan strain (Ken) of WNV (MOI 3) and cells harvested 24 hours post-infection, membrane-cytosol fractions were resolved by SDS-PAGE and analyzed for the presence of LC3B-II in the membrane fraction. F&G) BSCs were inoculated with WNV (104 pfu/well) and tissue harvested at specified time points post-infection, processed for whole-tissue lysate and analyzed for LC3B-II with western blot. 4 replicate experiments were analyzed for relative band density at 24 hrs post-infection as above (*p=0.006).
Figure 2
Figure 2
WNV-induced LC3B-II expression is due to autophagy activation. A) Mock and WNV (MOI 3) inoculated Vero cells were treated with 3MA (10mM) or vehicle control at time 0 and analyzed with western blot at 24 hours post-infection for evidence of LC3B-II. B) 5 replicate experiments were analyzed for relative LC3B-II band density showing a significant decrease in LC3B-II band density in 3MA-treated, WNV-infected cells (*p=0.016). C) BHK cells were transduced (MOI 3) with lentivirus expressing 3 different shRNA Atg5 constructs (shATG5-3, shATG5-4, shATG5-5), a non-targeting shRNA (nt-shRNA), or empty vector (EV) controls. At 48 hours post-transduction, cells were inoculated with mock (M) or WNV and harvested at 24 hours post-infection for western blot analysis of Atg5, LC3B, and β-actin protein expression.
Figure 3
Figure 3
WNV infection activates LC3B turnover but basal p62/SQSTM1 levels are unchanged. A) Vero cells were mock or WNV inoculated, followed by treatment with vehicle control, chloroquine (50μM), or bafilomycin (50nM). Whole cell lysates were evaluated for LC3B-II with western blot and relative LC3B-II band density analysis of 7 replicate experiments revealed a significant increase in LC3B-II following treatment with chloroquine and bafilomycin (*p=0.03). B) Western blot analysis of 4 replicate experiments of WNV-infected MCCs (MOI 3) at indicated time points post-infection for p62 and LC3B-II protein expression. C) Mock and WNV-inoculated Vero cells were harvested and western blot analysis for p62/SQSTM1 of 7 replicate experiments by densitometry show no evidence of altered p62 levels. D) Mock and WNV-inoculated Vero cells were treated with vehicle, chloroquine (50μM) or bafilomycin (50nM). Western blot analysis of p62 relative band density from 4 replicate experiments shows increased p62 with chloroquin and bafilomycin treatment. E) Mock and WNV-inoculated Vero cells were treated with vehicle or 3MA (10mM) and western blot analysis of relative p62 band density following 3MA treatment of WNV-infected cells in 8 replicate experiments is shown (*p=0.011). F) Vero cells were inoculated with mock, WNV clone, or a Kenyan (Ken) clone of WNV. Cells were harvested and cytosol-membrane fractions were analyzed for LC3B-II and p62 using western blot analysis. 6 replicate experiments were completed. All experiments were completed at 24 hours post-infection unless otherwise indicated. Densitometry is expressed as arbitrary units.
Figure 4
Figure 4. WNV-induced autophagosomes co-localize with lysosomes
Vero cells were transfected with a GFP-LC3 expressing plasmid and then A) mock inoculated or B) inoculated with WNV (MOI 3). C) As a control, Vero cells were treated with chloroquine (50μM) following transfection with GFP-LC3 expressing plasmid, harvested at 4 hours post-treatment. All cells were fixed and labeled with an antibody to LAMP1 (Cy3:red). Boxes in the merged images were digitally magnified (1000x) at the end of each row. Images are representative of 3 replicate experiments. Experiments were completed at 24 hours post-infection and images shown at 600x original magnification.
Figure 5
Figure 5. WNV infection results in acidification of autophagosomes
Vero cells were transfected with a plasmid expressing GFP-RFP-LC3 and treated with A) chloroquine (50μM) or B) trehalose (10mM) as assay controls. Cells were fixed and harvested at 4 hours post-treatment for fluorescent imaging. Chloroquine treated cells display continued GFP signal but trehalose activation of autophagy results in a shift to RFP signal due to autophagosome acidification. GFP-RFP-LC3 transfected cells were inoculated with C) mock or D) WNV (MOI 3) and cells were harvested at 24 hours post-infection. Mock infected cells display persistent GFP signal (green and yellow) while WNV infected cells exhibit a shift to RFP (red) signal. Images shown at 600x original magnification with boxes representing digitally magnified cells in the same row (1000x). Images representative of 3 replicate experiments and all nuclei were stained blue with DAPI.
Figure 6
Figure 6
WNV growth is independent of WNV-induced autophagy. A) MCCs were inoculated with mock or WNV (MOI 3) followed by treatment with trehalose (10mM) or vehicle control at time 0. Cells were harvested at 24 hours post-infection and analyzed for LC3B-II with western blot. B) MCCs were inoculated with WNV (MOI 0.1) followed by treatment with vehicle control or trehalose (10mM) at time 0 and every 24 hours with media change until cells were harvested at 72 hours post-infection in 5 replicate experiments. C) MCCs were treated daily with wortmannin (Wort, 0.2mM), DMSO control, 3MA (10mM), or water control for 48 hours and percent neuron survival calculated using trypan exclusion (*p=0.03). D) BSCs were infected with WNV (104 pfu/well), treated with vehicle controls, 3MA (10mM) or wortmannin (0.2mM) every 24 hours, and harvested at 72 hours post-infection for WNV titer using standard viral plaque assay (*p=0.003, n=6). E) BHK cells were transduced with lentivirus expressing one of three constructs of shRNA to Atg5 (shRNA Atg5-3, shRNA Atg5-4, shRNA Atg5-5) or a nontargeting shRNA (nt-shRNA). At 48 hours post-transduction, cells were inoculated with WNV (MOI 3) and viral titer of the supernatant determined at indicated time points (n=3). F) Serum fed Atg5(−/−) and Atg5(+/+) MEFs were infected with WNV (MOI 0.1). WNV titer assay of media at the specified time points post-infection show WNV growth of Atg5(−/−) MEFs compared to Atg5(+/+) MEFs (n=7). G) Atg5(−/−) and Atg5(+/+) MEFs were inoculated with WNV (MOI 0.1) and then fed media without serum at time 0 post-infection followed by viral titer of media at specified time points. Serum-starved (ss)Atg5 (−/−) and ssAtg5 (+/+) MEFs exhibit no significant difference in viral growth (n=9). H) Atg5 (+/+) MEF cells were infected with WNV (MOI 3) and cells harvested at 24 hours post-infection for western blot analysis of LC3B-II expression.
Figure 7
Figure 7
Electron Microscope images of WNV-induced Autophagosome-like structures. Cells were inoculated with A) mock or B) WNV (MOI 5) and harvested at 24 hours post-infection. Black arrows indicated autophagosome like structures and white arrows indicate virions. Scale bar=500nm.

References

    1. Blommaart EF, Krause U, Schellens JP, Vreeling-Sindelarova H, Meijer AJ. The phosphatidylinositol 3-kinase inhibitors wortmannin and LY294002 inhibit autophagy in isolated rat hepatocytes. Eur J Biochem. 1997;243:240–246. - PubMed
    1. Brault AC, Huang CY, Langevin SA, Kinney RM, Bowen RA, Ramey WN, Panella NA, Holmes EC, Powers AM, Miller BR. A single positively selected West Nile viral mutation confers increased virogenesis in American crows. Nat Genet. 2007;39:1162–1166. - PMC - PubMed
    1. Deretic V. Autophagy in infection. Curr Opin Cell Biol. 2010;22:252–262. - PMC - PubMed
    1. Dionne KR, Leser JS, Lorenzen KA, Beckham JD, Tyler KL. A brain slice culture model of viral encephalitis reveals an innate CNS cytokine response profile and the therapeutic potential of caspase inhibition. Exp Neurol. 2011;228(2):222–231. - PMC - PubMed
    1. Dreux M, Gastaminza P, Wieland SF, Chisari FV. The autophagy machinery is required to initiate hepatitis C virus replication. Proc Natl Acad Sci U S A. 2009;106:14046–14051. - PMC - PubMed

Publication types

MeSH terms

Substances